Norwegian vs Austrian Unemployment Among Seniors over 75 years
COMPARE
Norwegian
Austrian
Unemployment Among Seniors over 75 years
Unemployment Among Seniors over 75 years Comparison
Norwegians
Austrians
9.8%
UNEMPLOYMENT AMONG SENIORS OVER 75 YEARS
0.0/ 100
METRIC RATING
293rd/ 347
METRIC RANK
9.3%
UNEMPLOYMENT AMONG SENIORS OVER 75 YEARS
0.7/ 100
METRIC RATING
262nd/ 347
METRIC RANK
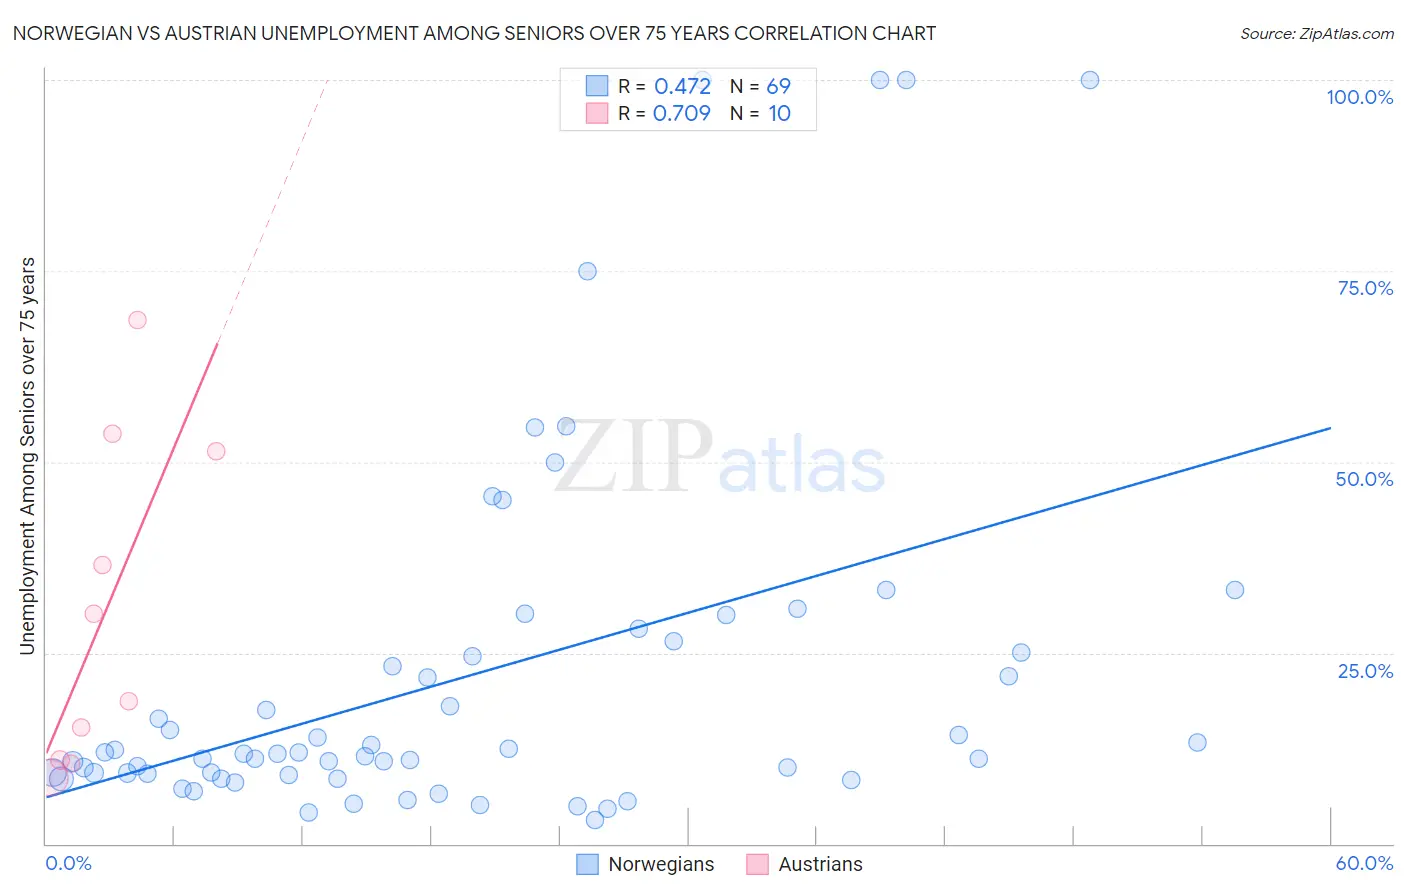
Norwegian vs Austrian Unemployment Among Seniors over 75 years Correlation Chart
The statistical analysis conducted on geographies consisting of 229,000,677 people shows a moderate positive correlation between the proportion of Norwegians and unemployment rate among seniors over the age of 75 in the United States with a correlation coefficient (R) of 0.472 and weighted average of 9.8%. Similarly, the statistical analysis conducted on geographies consisting of 215,407,440 people shows a strong positive correlation between the proportion of Austrians and unemployment rate among seniors over the age of 75 in the United States with a correlation coefficient (R) of 0.709 and weighted average of 9.3%, a difference of 5.1%.
Unemployment Among Seniors over 75 years Correlation Summary
| Measurement | Norwegian | Austrian |
| Minimum | 3.1% | 8.6% |
| Maximum | 100.0% | 68.6% |
| Range | 96.9% | 60.0% |
| Mean | 22.1% | 30.4% |
| Median | 11.7% | 24.4% |
| Interquartile 25% (IQ1) | 9.1% | 11.0% |
| Interquartile 75% (IQ3) | 25.8% | 51.4% |
| Interquartile Range (IQR) | 16.7% | 40.4% |
| Standard Deviation (Sample) | 24.0% | 21.3% |
| Standard Deviation (Population) | 23.8% | 20.2% |
Similar Demographics by Unemployment Among Seniors over 75 years
Demographics Similar to Norwegians by Unemployment Among Seniors over 75 years
In terms of unemployment among seniors over 75 years, the demographic groups most similar to Norwegians are Immigrants from Dominica (9.8%, a difference of 0.060%), Immigrants from Western Africa (9.8%, a difference of 0.17%), Nonimmigrants (9.8%, a difference of 0.42%), Scandinavian (9.7%, a difference of 0.46%), and Immigrants from St. Vincent and the Grenadines (9.8%, a difference of 0.47%).
| Demographics | Rating | Rank | Unemployment Among Seniors over 75 years |
| Nigerians | 0.0 /100 | #286 | Tragic 9.7% |
| Danes | 0.0 /100 | #287 | Tragic 9.7% |
| Canadians | 0.0 /100 | #288 | Tragic 9.7% |
| Czechs | 0.0 /100 | #289 | Tragic 9.7% |
| Sioux | 0.0 /100 | #290 | Tragic 9.7% |
| Scandinavians | 0.0 /100 | #291 | Tragic 9.7% |
| Immigrants | Western Africa | 0.0 /100 | #292 | Tragic 9.8% |
| Norwegians | 0.0 /100 | #293 | Tragic 9.8% |
| Immigrants | Dominica | 0.0 /100 | #294 | Tragic 9.8% |
| Immigrants | Nonimmigrants | 0.0 /100 | #295 | Tragic 9.8% |
| Immigrants | St. Vincent and the Grenadines | 0.0 /100 | #296 | Tragic 9.8% |
| Cherokee | 0.0 /100 | #297 | Tragic 9.8% |
| Lithuanians | 0.0 /100 | #298 | Tragic 9.9% |
| Belgians | 0.0 /100 | #299 | Tragic 9.9% |
| Iraqis | 0.0 /100 | #300 | Tragic 9.9% |
Demographics Similar to Austrians by Unemployment Among Seniors over 75 years
In terms of unemployment among seniors over 75 years, the demographic groups most similar to Austrians are Celtic (9.3%, a difference of 0.10%), Ukrainian (9.3%, a difference of 0.12%), Iroquois (9.3%, a difference of 0.13%), Palestinian (9.3%, a difference of 0.25%), and Immigrants from Cameroon (9.3%, a difference of 0.37%).
| Demographics | Rating | Rank | Unemployment Among Seniors over 75 years |
| Immigrants | Scotland | 1.4 /100 | #255 | Tragic 9.2% |
| Brazilians | 1.3 /100 | #256 | Tragic 9.3% |
| Hawaiians | 1.2 /100 | #257 | Tragic 9.3% |
| Immigrants | England | 1.0 /100 | #258 | Tragic 9.3% |
| Slovenes | 1.0 /100 | #259 | Tragic 9.3% |
| Immigrants | Cameroon | 1.0 /100 | #260 | Tragic 9.3% |
| Celtics | 0.8 /100 | #261 | Tragic 9.3% |
| Austrians | 0.7 /100 | #262 | Tragic 9.3% |
| Ukrainians | 0.7 /100 | #263 | Tragic 9.3% |
| Iroquois | 0.7 /100 | #264 | Tragic 9.3% |
| Palestinians | 0.6 /100 | #265 | Tragic 9.3% |
| Blacks/African Americans | 0.5 /100 | #266 | Tragic 9.4% |
| Immigrants | Mexico | 0.4 /100 | #267 | Tragic 9.4% |
| Greeks | 0.4 /100 | #268 | Tragic 9.4% |
| Puerto Ricans | 0.3 /100 | #269 | Tragic 9.4% |