Comanche vs Czechoslovakian Unemployment Among Seniors over 75 years
COMPARE
Comanche
Czechoslovakian
Unemployment Among Seniors over 75 years
Unemployment Among Seniors over 75 years Comparison
Comanche
Czechoslovakians
6.7%
UNEMPLOYMENT AMONG SENIORS OVER 75 YEARS
100.0/ 100
METRIC RATING
12th/ 347
METRIC RANK
9.4%
UNEMPLOYMENT AMONG SENIORS OVER 75 YEARS
0.3/ 100
METRIC RATING
273rd/ 347
METRIC RANK
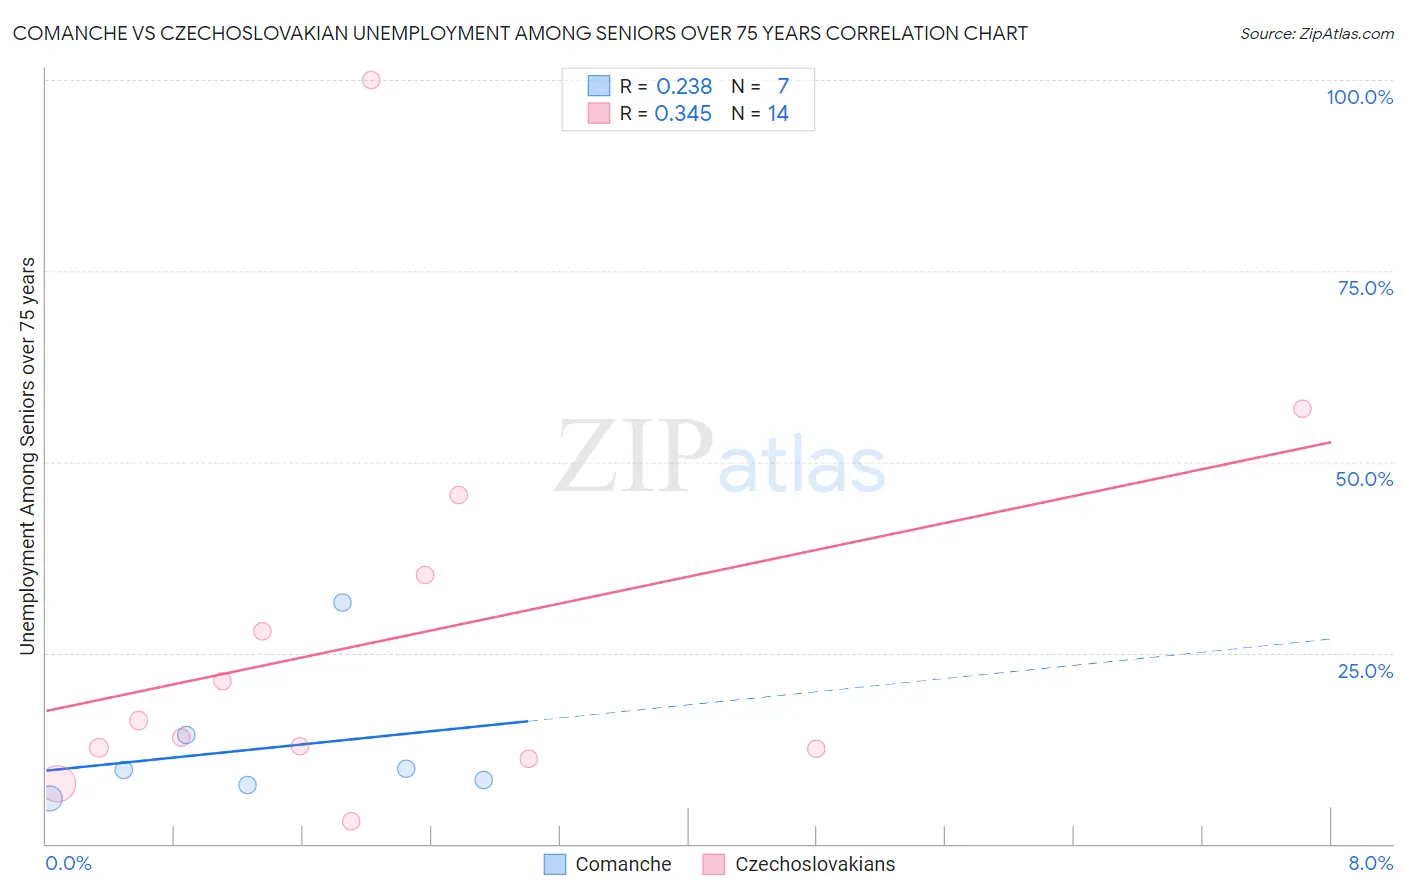
Comanche vs Czechoslovakian Unemployment Among Seniors over 75 years Correlation Chart
The statistical analysis conducted on geographies consisting of 77,452,477 people shows a weak positive correlation between the proportion of Comanche and unemployment rate among seniors over the age of 75 in the United States with a correlation coefficient (R) of 0.238 and weighted average of 6.7%. Similarly, the statistical analysis conducted on geographies consisting of 187,754,654 people shows a mild positive correlation between the proportion of Czechoslovakians and unemployment rate among seniors over the age of 75 in the United States with a correlation coefficient (R) of 0.345 and weighted average of 9.4%, a difference of 41.4%.
Unemployment Among Seniors over 75 years Correlation Summary
| Measurement | Comanche | Czechoslovakian |
| Minimum | 5.9% | 2.9% |
| Maximum | 31.6% | 100.0% |
| Range | 25.7% | 97.1% |
| Mean | 12.5% | 26.9% |
| Median | 9.7% | 15.0% |
| Interquartile 25% (IQ1) | 7.7% | 12.5% |
| Interquartile 75% (IQ3) | 14.3% | 35.2% |
| Interquartile Range (IQR) | 6.6% | 22.7% |
| Standard Deviation (Sample) | 8.8% | 26.0% |
| Standard Deviation (Population) | 8.2% | 25.0% |
Similar Demographics by Unemployment Among Seniors over 75 years
Demographics Similar to Comanche by Unemployment Among Seniors over 75 years
In terms of unemployment among seniors over 75 years, the demographic groups most similar to Comanche are Immigrants from Grenada (6.7%, a difference of 0.14%), Yuman (6.7%, a difference of 0.23%), Soviet Union (6.6%, a difference of 0.45%), Immigrants from Congo (6.7%, a difference of 0.81%), and Taiwanese (6.6%, a difference of 1.7%).
| Demographics | Rating | Rank | Unemployment Among Seniors over 75 years |
| Hopi | 100.0 /100 | #5 | Exceptional 6.3% |
| Immigrants | Armenia | 100.0 /100 | #6 | Exceptional 6.5% |
| Spanish American Indians | 100.0 /100 | #7 | Exceptional 6.5% |
| Taiwanese | 100.0 /100 | #8 | Exceptional 6.6% |
| Soviet Union | 100.0 /100 | #9 | Exceptional 6.6% |
| Yuman | 100.0 /100 | #10 | Exceptional 6.7% |
| Immigrants | Grenada | 100.0 /100 | #11 | Exceptional 6.7% |
| Comanche | 100.0 /100 | #12 | Exceptional 6.7% |
| Immigrants | Congo | 100.0 /100 | #13 | Exceptional 6.7% |
| Ute | 100.0 /100 | #14 | Exceptional 6.8% |
| Icelanders | 100.0 /100 | #15 | Exceptional 7.0% |
| Seminole | 100.0 /100 | #16 | Exceptional 7.1% |
| Immigrants | Switzerland | 100.0 /100 | #17 | Exceptional 7.2% |
| Immigrants | Uzbekistan | 100.0 /100 | #18 | Exceptional 7.2% |
| Immigrants | Zaire | 100.0 /100 | #19 | Exceptional 7.2% |
Demographics Similar to Czechoslovakians by Unemployment Among Seniors over 75 years
In terms of unemployment among seniors over 75 years, the demographic groups most similar to Czechoslovakians are Jamaican (9.5%, a difference of 0.12%), Immigrants from Iraq (9.4%, a difference of 0.14%), Bulgarian (9.4%, a difference of 0.17%), Yaqui (9.4%, a difference of 0.25%), and Senegalese (9.5%, a difference of 0.32%).
| Demographics | Rating | Rank | Unemployment Among Seniors over 75 years |
| Blacks/African Americans | 0.5 /100 | #266 | Tragic 9.4% |
| Immigrants | Mexico | 0.4 /100 | #267 | Tragic 9.4% |
| Greeks | 0.4 /100 | #268 | Tragic 9.4% |
| Puerto Ricans | 0.3 /100 | #269 | Tragic 9.4% |
| Yaqui | 0.3 /100 | #270 | Tragic 9.4% |
| Bulgarians | 0.3 /100 | #271 | Tragic 9.4% |
| Immigrants | Iraq | 0.3 /100 | #272 | Tragic 9.4% |
| Czechoslovakians | 0.3 /100 | #273 | Tragic 9.4% |
| Jamaicans | 0.2 /100 | #274 | Tragic 9.5% |
| Senegalese | 0.2 /100 | #275 | Tragic 9.5% |
| Arabs | 0.2 /100 | #276 | Tragic 9.5% |
| Swiss | 0.1 /100 | #277 | Tragic 9.5% |
| Immigrants | Senegal | 0.1 /100 | #278 | Tragic 9.6% |
| British | 0.1 /100 | #279 | Tragic 9.6% |
| Croatians | 0.1 /100 | #280 | Tragic 9.6% |