Spanish American vs Armenian Unemployment Among Youth under 25 years
COMPARE
Spanish American
Armenian
Unemployment Among Youth under 25 years
Unemployment Among Youth under 25 years Comparison
Spanish Americans
Armenians
12.2%
UNEMPLOYMENT AMONG YOUTH UNDER 25 YEARS
0.6/ 100
METRIC RATING
245th/ 347
METRIC RANK
13.3%
UNEMPLOYMENT AMONG YOUTH UNDER 25 YEARS
0.0/ 100
METRIC RATING
281st/ 347
METRIC RANK
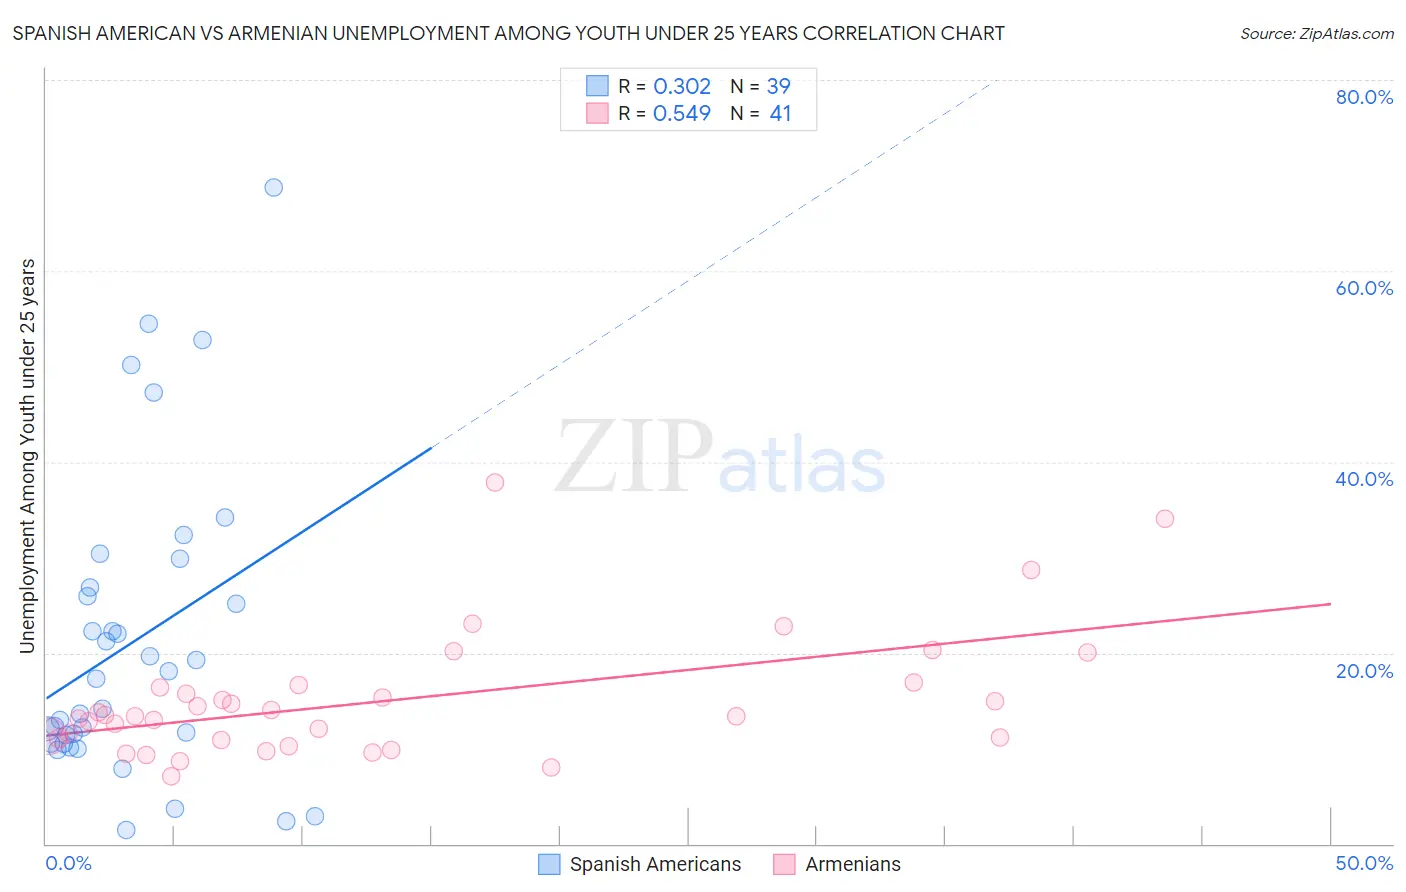
Spanish American vs Armenian Unemployment Among Youth under 25 years Correlation Chart
The statistical analysis conducted on geographies consisting of 102,840,374 people shows a mild positive correlation between the proportion of Spanish Americans and unemployment rate among youth under the age of 25 in the United States with a correlation coefficient (R) of 0.302 and weighted average of 12.2%. Similarly, the statistical analysis conducted on geographies consisting of 307,706,627 people shows a substantial positive correlation between the proportion of Armenians and unemployment rate among youth under the age of 25 in the United States with a correlation coefficient (R) of 0.549 and weighted average of 13.3%, a difference of 8.8%.
Unemployment Among Youth under 25 years Correlation Summary
| Measurement | Spanish American | Armenian |
| Minimum | 1.5% | 7.1% |
| Maximum | 68.7% | 37.8% |
| Range | 67.2% | 30.7% |
| Mean | 21.1% | 15.0% |
| Median | 17.3% | 13.3% |
| Interquartile 25% (IQ1) | 10.5% | 10.9% |
| Interquartile 75% (IQ3) | 26.8% | 16.5% |
| Interquartile Range (IQR) | 16.3% | 5.6% |
| Standard Deviation (Sample) | 15.6% | 6.6% |
| Standard Deviation (Population) | 15.4% | 6.5% |
Similar Demographics by Unemployment Among Youth under 25 years
Demographics Similar to Spanish Americans by Unemployment Among Youth under 25 years
In terms of unemployment among youth under 25 years, the demographic groups most similar to Spanish Americans are Immigrants from Honduras (12.2%, a difference of 0.0%), Immigrants from the Azores (12.2%, a difference of 0.010%), Alaskan Athabascan (12.2%, a difference of 0.010%), Immigrants from Greece (12.2%, a difference of 0.11%), and Central American (12.2%, a difference of 0.13%).
| Demographics | Rating | Rank | Unemployment Among Youth under 25 years |
| Albanians | 1.2 /100 | #238 | Tragic 12.1% |
| Immigrants | Africa | 1.1 /100 | #239 | Tragic 12.1% |
| Dutch West Indians | 1.1 /100 | #240 | Tragic 12.1% |
| Immigrants | Albania | 1.1 /100 | #241 | Tragic 12.1% |
| Immigrants | Western Asia | 0.8 /100 | #242 | Tragic 12.2% |
| Immigrants | Azores | 0.6 /100 | #243 | Tragic 12.2% |
| Alaskan Athabascans | 0.6 /100 | #244 | Tragic 12.2% |
| Spanish Americans | 0.6 /100 | #245 | Tragic 12.2% |
| Immigrants | Honduras | 0.6 /100 | #246 | Tragic 12.2% |
| Immigrants | Greece | 0.6 /100 | #247 | Tragic 12.2% |
| Central Americans | 0.6 /100 | #248 | Tragic 12.2% |
| Soviet Union | 0.6 /100 | #249 | Tragic 12.2% |
| Delaware | 0.4 /100 | #250 | Tragic 12.3% |
| Mexican American Indians | 0.4 /100 | #251 | Tragic 12.3% |
| Immigrants | Syria | 0.3 /100 | #252 | Tragic 12.3% |
Demographics Similar to Armenians by Unemployment Among Youth under 25 years
In terms of unemployment among youth under 25 years, the demographic groups most similar to Armenians are Sierra Leonean (13.3%, a difference of 0.010%), Ute (13.3%, a difference of 0.030%), Immigrants from Cameroon (13.3%, a difference of 0.030%), Lumbee (13.3%, a difference of 0.050%), and Ghanaian (13.3%, a difference of 0.13%).
| Demographics | Rating | Rank | Unemployment Among Youth under 25 years |
| Immigrants | Nigeria | 0.0 /100 | #274 | Tragic 13.0% |
| Bermudans | 0.0 /100 | #275 | Tragic 13.0% |
| Immigrants | Uzbekistan | 0.0 /100 | #276 | Tragic 13.1% |
| Bahamians | 0.0 /100 | #277 | Tragic 13.1% |
| Africans | 0.0 /100 | #278 | Tragic 13.2% |
| Cajuns | 0.0 /100 | #279 | Tragic 13.2% |
| Ute | 0.0 /100 | #280 | Tragic 13.3% |
| Armenians | 0.0 /100 | #281 | Tragic 13.3% |
| Sierra Leoneans | 0.0 /100 | #282 | Tragic 13.3% |
| Immigrants | Cameroon | 0.0 /100 | #283 | Tragic 13.3% |
| Lumbee | 0.0 /100 | #284 | Tragic 13.3% |
| Ghanaians | 0.0 /100 | #285 | Tragic 13.3% |
| Blackfeet | 0.0 /100 | #286 | Tragic 13.3% |
| Ecuadorians | 0.0 /100 | #287 | Tragic 13.3% |
| Immigrants | Western Africa | 0.0 /100 | #288 | Tragic 13.4% |