Nigerian vs Belizean Family Households with Children
COMPARE
Nigerian
Belizean
Family Households with Children
Family Households with Children Comparison
Nigerians
Belizeans
28.4%
FAMILY HOUSEHOLDS WITH CHILDREN
99.8/ 100
METRIC RATING
77th/ 347
METRIC RANK
27.8%
FAMILY HOUSEHOLDS WITH CHILDREN
90.0/ 100
METRIC RATING
127th/ 347
METRIC RANK
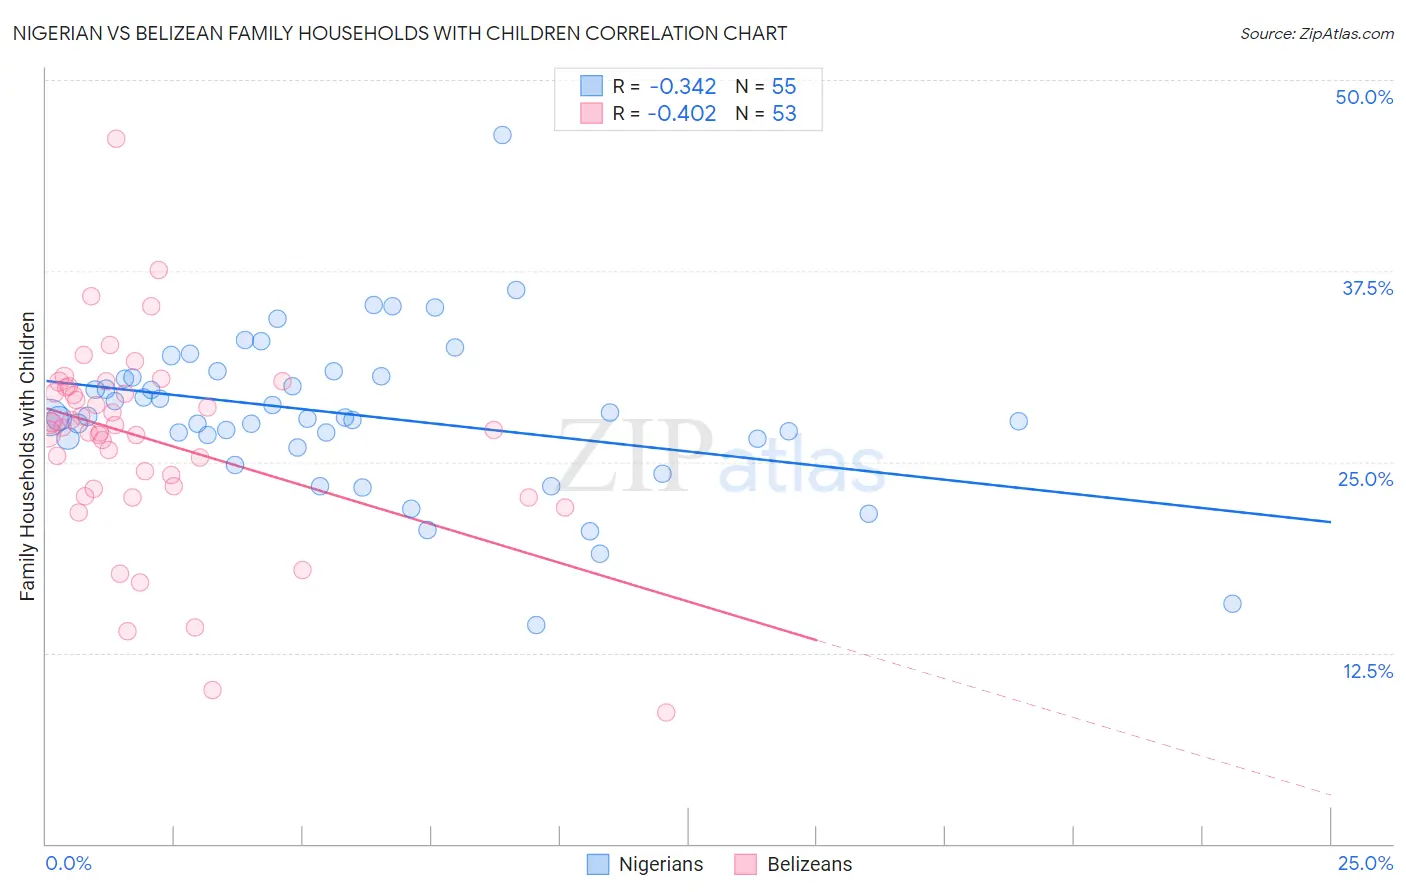
Nigerian vs Belizean Family Households with Children Correlation Chart
The statistical analysis conducted on geographies consisting of 332,387,901 people shows a mild negative correlation between the proportion of Nigerians and percentage of family households with children in the United States with a correlation coefficient (R) of -0.342 and weighted average of 28.4%. Similarly, the statistical analysis conducted on geographies consisting of 144,146,110 people shows a moderate negative correlation between the proportion of Belizeans and percentage of family households with children in the United States with a correlation coefficient (R) of -0.402 and weighted average of 27.8%, a difference of 2.3%.
Family Households with Children Correlation Summary
| Measurement | Nigerian | Belizean |
| Minimum | 14.3% | 8.6% |
| Maximum | 46.4% | 46.2% |
| Range | 32.1% | 37.6% |
| Mean | 28.1% | 26.4% |
| Median | 27.9% | 27.3% |
| Interquartile 25% (IQ1) | 26.5% | 23.3% |
| Interquartile 75% (IQ3) | 30.6% | 29.9% |
| Interquartile Range (IQR) | 4.1% | 6.6% |
| Standard Deviation (Sample) | 5.2% | 6.5% |
| Standard Deviation (Population) | 5.2% | 6.4% |
Similar Demographics by Family Households with Children
Demographics Similar to Nigerians by Family Households with Children
In terms of family households with children, the demographic groups most similar to Nigerians are Immigrants from Nepal (28.4%, a difference of 0.040%), Immigrants from Sri Lanka (28.4%, a difference of 0.050%), Immigrants from Jordan (28.4%, a difference of 0.060%), Immigrants from Iraq (28.4%, a difference of 0.070%), and Native/Alaskan (28.4%, a difference of 0.080%).
| Demographics | Rating | Rank | Family Households with Children |
| Immigrants | Honduras | 99.9 /100 | #70 | Exceptional 28.5% |
| Burmese | 99.9 /100 | #71 | Exceptional 28.5% |
| Immigrants | Indonesia | 99.9 /100 | #72 | Exceptional 28.5% |
| Iraqis | 99.9 /100 | #73 | Exceptional 28.5% |
| Laotians | 99.9 /100 | #74 | Exceptional 28.5% |
| Immigrants | Jordan | 99.9 /100 | #75 | Exceptional 28.4% |
| Immigrants | Sri Lanka | 99.9 /100 | #76 | Exceptional 28.4% |
| Nigerians | 99.8 /100 | #77 | Exceptional 28.4% |
| Immigrants | Nepal | 99.8 /100 | #78 | Exceptional 28.4% |
| Immigrants | Iraq | 99.8 /100 | #79 | Exceptional 28.4% |
| Natives/Alaskans | 99.8 /100 | #80 | Exceptional 28.4% |
| South Americans | 99.8 /100 | #81 | Exceptional 28.4% |
| Kenyans | 99.8 /100 | #82 | Exceptional 28.4% |
| Nicaraguans | 99.8 /100 | #83 | Exceptional 28.4% |
| Costa Ricans | 99.8 /100 | #84 | Exceptional 28.4% |
Demographics Similar to Belizeans by Family Households with Children
In terms of family households with children, the demographic groups most similar to Belizeans are Syrian (27.8%, a difference of 0.020%), Immigrants from Ethiopia (27.8%, a difference of 0.030%), Immigrants from Eritrea (27.8%, a difference of 0.040%), Immigrants from Singapore (27.8%, a difference of 0.050%), and Ecuadorian (27.8%, a difference of 0.050%).
| Demographics | Rating | Rank | Family Households with Children |
| Europeans | 95.4 /100 | #120 | Exceptional 27.9% |
| Immigrants | Western Asia | 93.6 /100 | #121 | Exceptional 27.9% |
| Immigrants | Zimbabwe | 92.8 /100 | #122 | Exceptional 27.8% |
| Immigrants | Northern Africa | 91.8 /100 | #123 | Exceptional 27.8% |
| Immigrants | Singapore | 90.8 /100 | #124 | Exceptional 27.8% |
| Ecuadorians | 90.8 /100 | #125 | Exceptional 27.8% |
| Immigrants | Ethiopia | 90.5 /100 | #126 | Exceptional 27.8% |
| Belizeans | 90.0 /100 | #127 | Exceptional 27.8% |
| Syrians | 89.7 /100 | #128 | Excellent 27.8% |
| Immigrants | Eritrea | 89.4 /100 | #129 | Excellent 27.8% |
| Cajuns | 87.6 /100 | #130 | Excellent 27.7% |
| Lebanese | 87.4 /100 | #131 | Excellent 27.7% |
| Immigrants | Belize | 85.7 /100 | #132 | Excellent 27.7% |
| Iranians | 85.2 /100 | #133 | Excellent 27.7% |
| Immigrants | Panama | 84.9 /100 | #134 | Excellent 27.7% |