Belizean vs Immigrants from Guyana Unemployment Among Women with Children Under 6 years
COMPARE
Belizean
Immigrants from Guyana
Unemployment Among Women with Children Under 6 years
Unemployment Among Women with Children Under 6 years Comparison
Belizeans
Immigrants from Guyana
8.4%
UNEMPLOYMENT AMONG WOMEN WITH CHILDREN UNDER 6 YEARS
0.2/ 100
METRIC RATING
267th/ 347
METRIC RANK
8.2%
UNEMPLOYMENT AMONG WOMEN WITH CHILDREN UNDER 6 YEARS
0.8/ 100
METRIC RATING
253rd/ 347
METRIC RANK
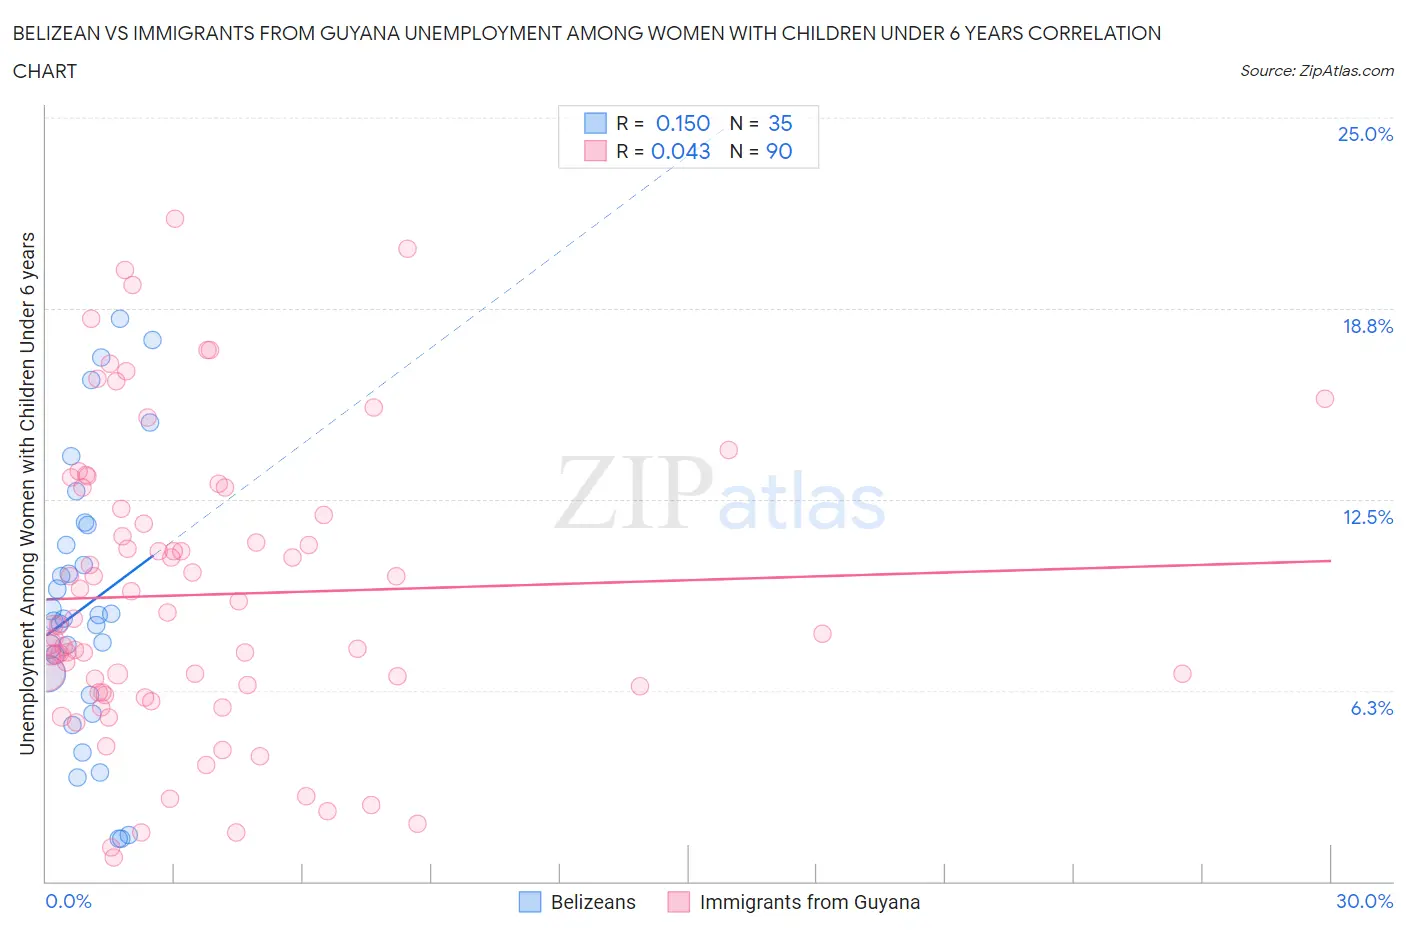
Belizean vs Immigrants from Guyana Unemployment Among Women with Children Under 6 years Correlation Chart
The statistical analysis conducted on geographies consisting of 129,056,048 people shows a poor positive correlation between the proportion of Belizeans and unemployment rate among women with children under the age of 6 in the United States with a correlation coefficient (R) of 0.150 and weighted average of 8.4%. Similarly, the statistical analysis conducted on geographies consisting of 155,055,932 people shows no correlation between the proportion of Immigrants from Guyana and unemployment rate among women with children under the age of 6 in the United States with a correlation coefficient (R) of 0.043 and weighted average of 8.2%, a difference of 2.1%.
Unemployment Among Women with Children Under 6 years Correlation Summary
| Measurement | Belizean | Immigrants from Guyana |
| Minimum | 1.4% | 0.77% |
| Maximum | 18.4% | 21.7% |
| Range | 17.0% | 20.9% |
| Mean | 9.0% | 9.4% |
| Median | 8.6% | 8.4% |
| Interquartile 25% (IQ1) | 6.1% | 6.2% |
| Interquartile 75% (IQ3) | 11.7% | 12.2% |
| Interquartile Range (IQR) | 5.6% | 6.0% |
| Standard Deviation (Sample) | 4.5% | 4.8% |
| Standard Deviation (Population) | 4.4% | 4.8% |
Demographics Similar to Belizeans and Immigrants from Guyana by Unemployment Among Women with Children Under 6 years
In terms of unemployment among women with children under 6 years, the demographic groups most similar to Belizeans are Subsaharan African (8.4%, a difference of 0.10%), Immigrants from Haiti (8.4%, a difference of 0.19%), Immigrants from Honduras (8.4%, a difference of 0.26%), French Canadian (8.4%, a difference of 0.27%), and Honduran (8.4%, a difference of 0.32%). Similarly, the demographic groups most similar to Immigrants from Guyana are Guyanese (8.2%, a difference of 0.18%), Ghanaian (8.2%, a difference of 0.18%), Immigrants from Caribbean (8.3%, a difference of 0.27%), Nigerian (8.2%, a difference of 0.35%), and Immigrants from Portugal (8.3%, a difference of 0.56%).
| Demographics | Rating | Rank | Unemployment Among Women with Children Under 6 years |
| Nigerians | 1.1 /100 | #250 | Tragic 8.2% |
| Guyanese | 1.0 /100 | #251 | Tragic 8.2% |
| Ghanaians | 1.0 /100 | #252 | Tragic 8.2% |
| Immigrants | Guyana | 0.8 /100 | #253 | Tragic 8.2% |
| Immigrants | Caribbean | 0.7 /100 | #254 | Tragic 8.3% |
| Immigrants | Portugal | 0.6 /100 | #255 | Tragic 8.3% |
| Celtics | 0.6 /100 | #256 | Tragic 8.3% |
| British West Indians | 0.5 /100 | #257 | Tragic 8.3% |
| Immigrants | Ghana | 0.5 /100 | #258 | Tragic 8.3% |
| Barbadians | 0.4 /100 | #259 | Tragic 8.3% |
| Whites/Caucasians | 0.3 /100 | #260 | Tragic 8.4% |
| Immigrants | Liberia | 0.3 /100 | #261 | Tragic 8.4% |
| West Indians | 0.3 /100 | #262 | Tragic 8.4% |
| Scotch-Irish | 0.3 /100 | #263 | Tragic 8.4% |
| Hondurans | 0.3 /100 | #264 | Tragic 8.4% |
| French Canadians | 0.3 /100 | #265 | Tragic 8.4% |
| Immigrants | Honduras | 0.3 /100 | #266 | Tragic 8.4% |
| Belizeans | 0.2 /100 | #267 | Tragic 8.4% |
| Sub-Saharan Africans | 0.2 /100 | #268 | Tragic 8.4% |
| Immigrants | Haiti | 0.2 /100 | #269 | Tragic 8.4% |
| Immigrants | Senegal | 0.2 /100 | #270 | Tragic 8.5% |