Cuban vs Immigrants from Guyana Unemployment Among Women with Children Under 6 years
COMPARE
Cuban
Immigrants from Guyana
Unemployment Among Women with Children Under 6 years
Unemployment Among Women with Children Under 6 years Comparison
Cubans
Immigrants from Guyana
7.0%
UNEMPLOYMENT AMONG WOMEN WITH CHILDREN UNDER 6 YEARS
99.4/ 100
METRIC RATING
72nd/ 347
METRIC RANK
8.2%
UNEMPLOYMENT AMONG WOMEN WITH CHILDREN UNDER 6 YEARS
0.8/ 100
METRIC RATING
253rd/ 347
METRIC RANK
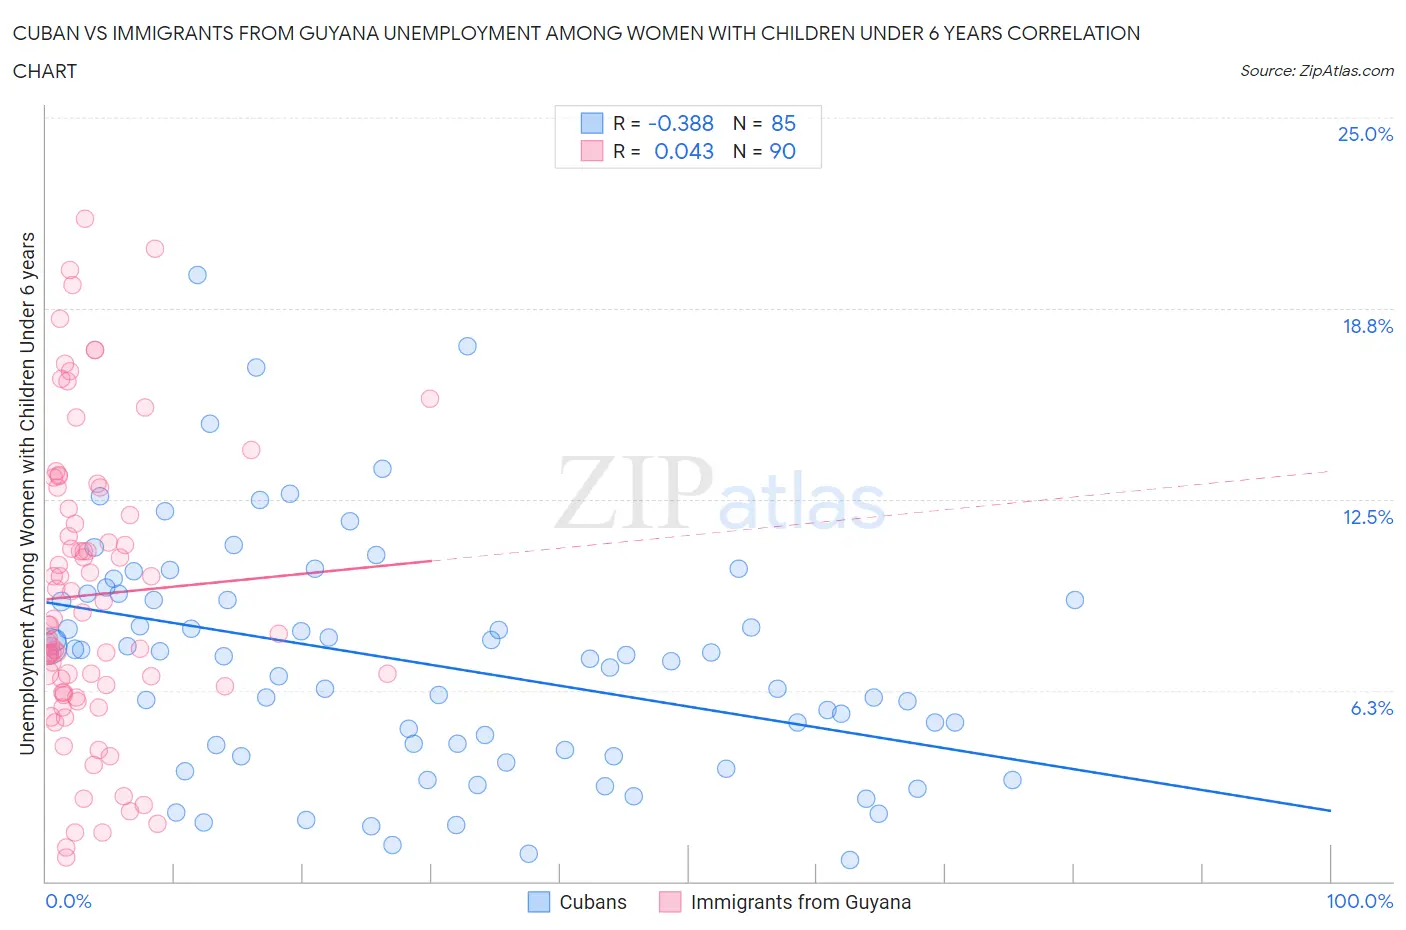
Cuban vs Immigrants from Guyana Unemployment Among Women with Children Under 6 years Correlation Chart
The statistical analysis conducted on geographies consisting of 334,950,414 people shows a mild negative correlation between the proportion of Cubans and unemployment rate among women with children under the age of 6 in the United States with a correlation coefficient (R) of -0.388 and weighted average of 7.0%. Similarly, the statistical analysis conducted on geographies consisting of 155,055,932 people shows no correlation between the proportion of Immigrants from Guyana and unemployment rate among women with children under the age of 6 in the United States with a correlation coefficient (R) of 0.043 and weighted average of 8.2%, a difference of 17.8%.
Unemployment Among Women with Children Under 6 years Correlation Summary
| Measurement | Cuban | Immigrants from Guyana |
| Minimum | 0.70% | 0.77% |
| Maximum | 19.8% | 21.7% |
| Range | 19.1% | 20.9% |
| Mean | 7.1% | 9.4% |
| Median | 7.3% | 8.4% |
| Interquartile 25% (IQ1) | 4.2% | 6.2% |
| Interquartile 75% (IQ3) | 9.3% | 12.2% |
| Interquartile Range (IQR) | 5.1% | 6.0% |
| Standard Deviation (Sample) | 3.8% | 4.8% |
| Standard Deviation (Population) | 3.8% | 4.8% |
Similar Demographics by Unemployment Among Women with Children Under 6 years
Demographics Similar to Cubans by Unemployment Among Women with Children Under 6 years
In terms of unemployment among women with children under 6 years, the demographic groups most similar to Cubans are Afghan (7.0%, a difference of 0.11%), Immigrants from Iraq (7.0%, a difference of 0.13%), Immigrants from Eritrea (7.0%, a difference of 0.14%), Paraguayan (7.0%, a difference of 0.18%), and Immigrants from Netherlands (7.0%, a difference of 0.40%).
| Demographics | Rating | Rank | Unemployment Among Women with Children Under 6 years |
| Immigrants | Kuwait | 99.7 /100 | #65 | Exceptional 6.9% |
| Immigrants | Belgium | 99.6 /100 | #66 | Exceptional 6.9% |
| Immigrants | Netherlands | 99.5 /100 | #67 | Exceptional 7.0% |
| Paraguayans | 99.4 /100 | #68 | Exceptional 7.0% |
| Immigrants | Eritrea | 99.4 /100 | #69 | Exceptional 7.0% |
| Immigrants | Iraq | 99.4 /100 | #70 | Exceptional 7.0% |
| Afghans | 99.4 /100 | #71 | Exceptional 7.0% |
| Cubans | 99.4 /100 | #72 | Exceptional 7.0% |
| Immigrants | Czechoslovakia | 99.2 /100 | #73 | Exceptional 7.0% |
| Turks | 99.2 /100 | #74 | Exceptional 7.0% |
| Immigrants | Eastern Europe | 99.0 /100 | #75 | Exceptional 7.1% |
| Estonians | 99.0 /100 | #76 | Exceptional 7.1% |
| Immigrants | Croatia | 98.9 /100 | #77 | Exceptional 7.1% |
| Immigrants | Somalia | 98.9 /100 | #78 | Exceptional 7.1% |
| Immigrants | Fiji | 98.9 /100 | #79 | Exceptional 7.1% |
Demographics Similar to Immigrants from Guyana by Unemployment Among Women with Children Under 6 years
In terms of unemployment among women with children under 6 years, the demographic groups most similar to Immigrants from Guyana are Guyanese (8.2%, a difference of 0.18%), Ghanaian (8.2%, a difference of 0.18%), Immigrants from Caribbean (8.3%, a difference of 0.27%), Nigerian (8.2%, a difference of 0.35%), and Immigrants from Sierra Leone (8.2%, a difference of 0.36%).
| Demographics | Rating | Rank | Unemployment Among Women with Children Under 6 years |
| Central Americans | 1.4 /100 | #246 | Tragic 8.2% |
| German Russians | 1.2 /100 | #247 | Tragic 8.2% |
| Immigrants | Western Africa | 1.1 /100 | #248 | Tragic 8.2% |
| Immigrants | Sierra Leone | 1.1 /100 | #249 | Tragic 8.2% |
| Nigerians | 1.1 /100 | #250 | Tragic 8.2% |
| Guyanese | 1.0 /100 | #251 | Tragic 8.2% |
| Ghanaians | 1.0 /100 | #252 | Tragic 8.2% |
| Immigrants | Guyana | 0.8 /100 | #253 | Tragic 8.2% |
| Immigrants | Caribbean | 0.7 /100 | #254 | Tragic 8.3% |
| Immigrants | Portugal | 0.6 /100 | #255 | Tragic 8.3% |
| Celtics | 0.6 /100 | #256 | Tragic 8.3% |
| British West Indians | 0.5 /100 | #257 | Tragic 8.3% |
| Immigrants | Ghana | 0.5 /100 | #258 | Tragic 8.3% |
| Barbadians | 0.4 /100 | #259 | Tragic 8.3% |
| Whites/Caucasians | 0.3 /100 | #260 | Tragic 8.4% |