New Zealander vs Czechoslovakian Unemployment Among Women with Children Under 6 years
COMPARE
New Zealander
Czechoslovakian
Unemployment Among Women with Children Under 6 years
Unemployment Among Women with Children Under 6 years Comparison
New Zealanders
Czechoslovakians
7.2%
UNEMPLOYMENT AMONG WOMEN WITH CHILDREN UNDER 6 YEARS
97.8/ 100
METRIC RATING
93rd/ 347
METRIC RANK
7.7%
UNEMPLOYMENT AMONG WOMEN WITH CHILDREN UNDER 6 YEARS
38.4/ 100
METRIC RATING
188th/ 347
METRIC RANK
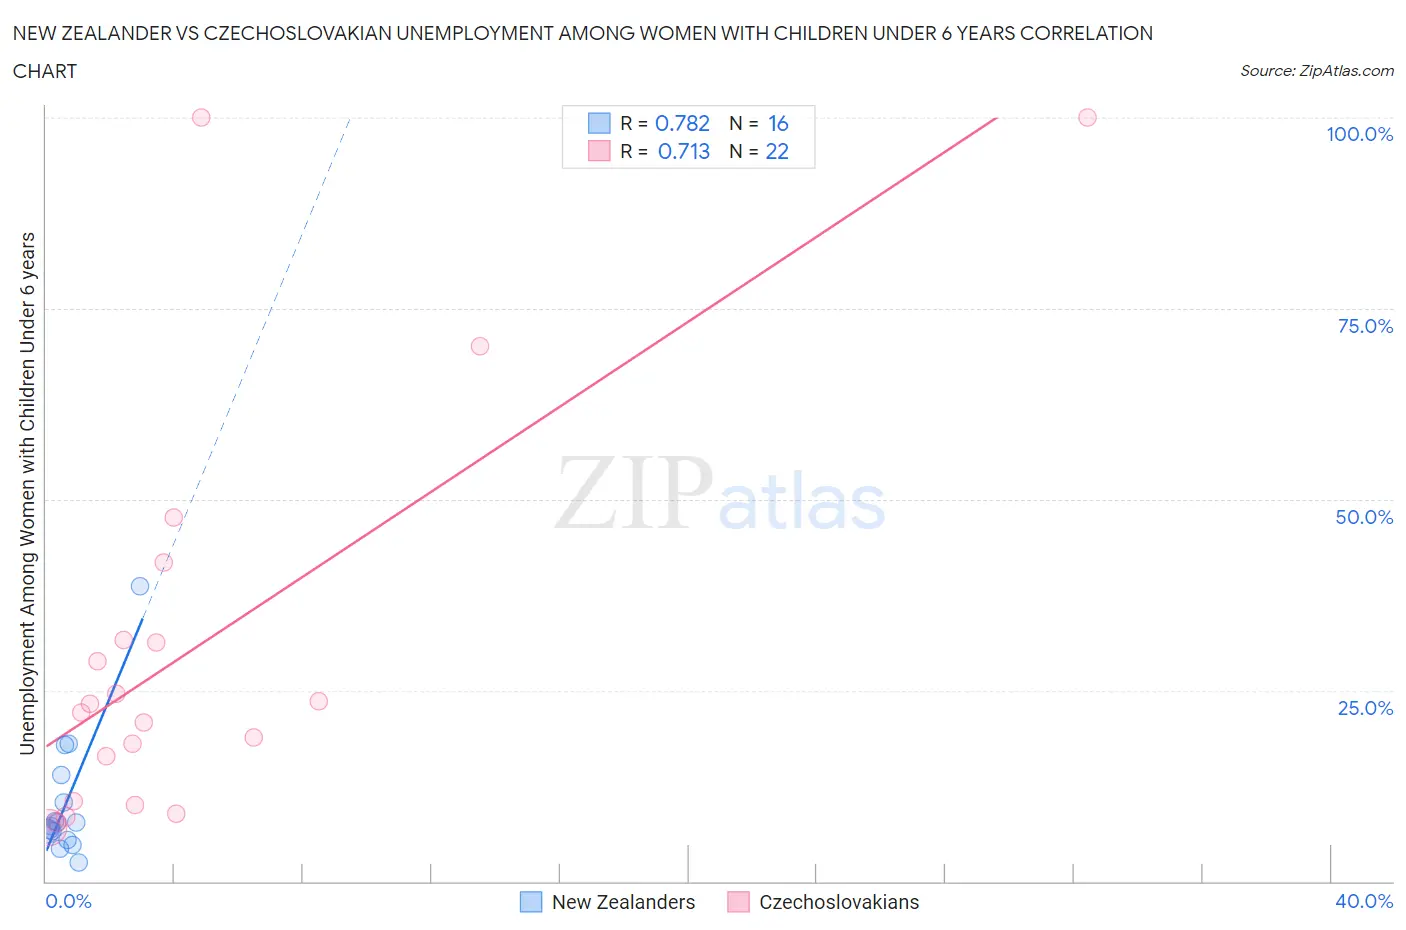
New Zealander vs Czechoslovakian Unemployment Among Women with Children Under 6 years Correlation Chart
The statistical analysis conducted on geographies consisting of 97,246,920 people shows a strong positive correlation between the proportion of New Zealanders and unemployment rate among women with children under the age of 6 in the United States with a correlation coefficient (R) of 0.782 and weighted average of 7.2%. Similarly, the statistical analysis conducted on geographies consisting of 272,908,849 people shows a strong positive correlation between the proportion of Czechoslovakians and unemployment rate among women with children under the age of 6 in the United States with a correlation coefficient (R) of 0.713 and weighted average of 7.7%, a difference of 7.5%.
Unemployment Among Women with Children Under 6 years Correlation Summary
| Measurement | New Zealander | Czechoslovakian |
| Minimum | 2.5% | 7.1% |
| Maximum | 38.6% | 100.0% |
| Range | 36.1% | 92.9% |
| Mean | 10.4% | 30.5% |
| Median | 7.4% | 22.7% |
| Interquartile 25% (IQ1) | 5.9% | 10.5% |
| Interquartile 75% (IQ3) | 12.1% | 31.6% |
| Interquartile Range (IQR) | 6.1% | 21.1% |
| Standard Deviation (Sample) | 8.8% | 27.0% |
| Standard Deviation (Population) | 8.5% | 26.4% |
Similar Demographics by Unemployment Among Women with Children Under 6 years
Demographics Similar to New Zealanders by Unemployment Among Women with Children Under 6 years
In terms of unemployment among women with children under 6 years, the demographic groups most similar to New Zealanders are Macedonian (7.2%, a difference of 0.070%), Romanian (7.2%, a difference of 0.11%), Immigrants from Eastern Africa (7.2%, a difference of 0.13%), Albanian (7.2%, a difference of 0.18%), and Immigrants from South Eastern Asia (7.2%, a difference of 0.20%).
| Demographics | Rating | Rank | Unemployment Among Women with Children Under 6 years |
| Immigrants | Zimbabwe | 98.6 /100 | #86 | Exceptional 7.1% |
| Alsatians | 98.4 /100 | #87 | Exceptional 7.1% |
| Immigrants | Hungary | 98.3 /100 | #88 | Exceptional 7.1% |
| Immigrants | Denmark | 98.3 /100 | #89 | Exceptional 7.1% |
| Immigrants | Spain | 98.2 /100 | #90 | Exceptional 7.1% |
| Danes | 98.2 /100 | #91 | Exceptional 7.1% |
| Albanians | 98.0 /100 | #92 | Exceptional 7.2% |
| New Zealanders | 97.8 /100 | #93 | Exceptional 7.2% |
| Macedonians | 97.7 /100 | #94 | Exceptional 7.2% |
| Romanians | 97.7 /100 | #95 | Exceptional 7.2% |
| Immigrants | Eastern Africa | 97.7 /100 | #96 | Exceptional 7.2% |
| Immigrants | South Eastern Asia | 97.6 /100 | #97 | Exceptional 7.2% |
| Russians | 97.5 /100 | #98 | Exceptional 7.2% |
| Immigrants | Europe | 97.5 /100 | #99 | Exceptional 7.2% |
| Immigrants | Northern Europe | 97.4 /100 | #100 | Exceptional 7.2% |
Demographics Similar to Czechoslovakians by Unemployment Among Women with Children Under 6 years
In terms of unemployment among women with children under 6 years, the demographic groups most similar to Czechoslovakians are Immigrants from Thailand (7.7%, a difference of 0.010%), Yugoslavian (7.7%, a difference of 0.060%), Spanish American (7.7%, a difference of 0.080%), Indonesian (7.7%, a difference of 0.14%), and Immigrants from Panama (7.7%, a difference of 0.20%).
| Demographics | Rating | Rank | Unemployment Among Women with Children Under 6 years |
| Brazilians | 43.9 /100 | #181 | Average 7.7% |
| Nepalese | 43.5 /100 | #182 | Average 7.7% |
| Sierra Leoneans | 42.9 /100 | #183 | Average 7.7% |
| Indonesians | 40.5 /100 | #184 | Average 7.7% |
| Spanish Americans | 39.7 /100 | #185 | Fair 7.7% |
| Yugoslavians | 39.4 /100 | #186 | Fair 7.7% |
| Immigrants | Thailand | 38.5 /100 | #187 | Fair 7.7% |
| Czechoslovakians | 38.4 /100 | #188 | Fair 7.7% |
| Immigrants | Panama | 35.7 /100 | #189 | Fair 7.7% |
| Immigrants | North Macedonia | 34.4 /100 | #190 | Fair 7.7% |
| Immigrants | Austria | 32.4 /100 | #191 | Fair 7.7% |
| Immigrants | Africa | 32.4 /100 | #192 | Fair 7.7% |
| Slavs | 32.4 /100 | #193 | Fair 7.7% |
| Syrians | 31.9 /100 | #194 | Fair 7.7% |
| Malaysians | 31.1 /100 | #195 | Fair 7.7% |