New Zealander vs Cherokee Unemployment Among Women with Children Under 6 years
COMPARE
New Zealander
Cherokee
Unemployment Among Women with Children Under 6 years
Unemployment Among Women with Children Under 6 years Comparison
New Zealanders
Cherokee
7.2%
UNEMPLOYMENT AMONG WOMEN WITH CHILDREN UNDER 6 YEARS
97.8/ 100
METRIC RATING
93rd/ 347
METRIC RANK
9.3%
UNEMPLOYMENT AMONG WOMEN WITH CHILDREN UNDER 6 YEARS
0.0/ 100
METRIC RATING
315th/ 347
METRIC RANK
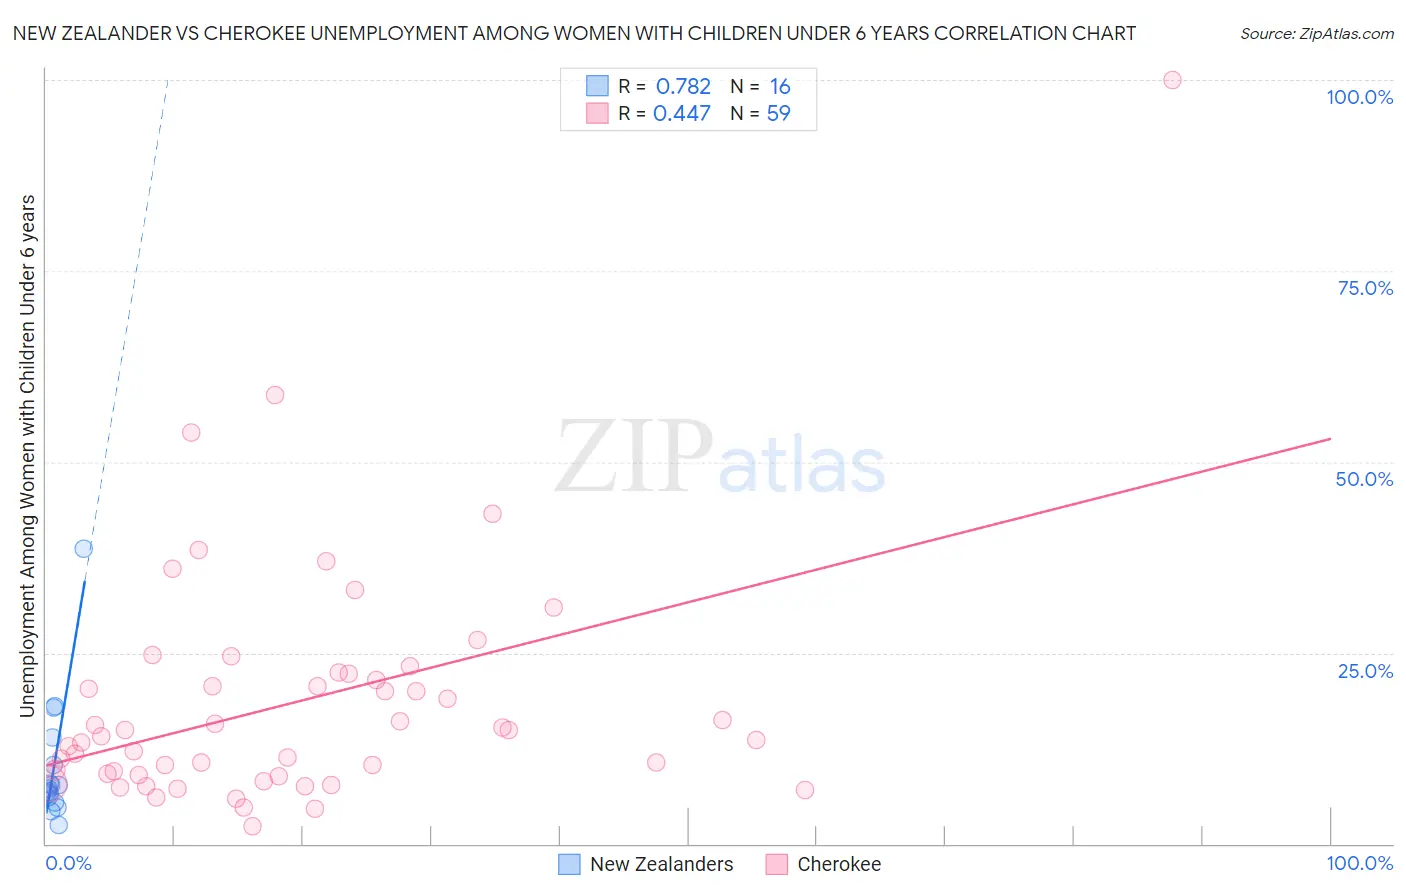
New Zealander vs Cherokee Unemployment Among Women with Children Under 6 years Correlation Chart
The statistical analysis conducted on geographies consisting of 97,246,920 people shows a strong positive correlation between the proportion of New Zealanders and unemployment rate among women with children under the age of 6 in the United States with a correlation coefficient (R) of 0.782 and weighted average of 7.2%. Similarly, the statistical analysis conducted on geographies consisting of 349,052,649 people shows a moderate positive correlation between the proportion of Cherokee and unemployment rate among women with children under the age of 6 in the United States with a correlation coefficient (R) of 0.447 and weighted average of 9.3%, a difference of 30.2%.
Unemployment Among Women with Children Under 6 years Correlation Summary
| Measurement | New Zealander | Cherokee |
| Minimum | 2.5% | 2.3% |
| Maximum | 38.6% | 100.0% |
| Range | 36.1% | 97.7% |
| Mean | 10.4% | 18.6% |
| Median | 7.4% | 14.1% |
| Interquartile 25% (IQ1) | 5.9% | 9.0% |
| Interquartile 75% (IQ3) | 12.1% | 22.2% |
| Interquartile Range (IQR) | 6.1% | 13.2% |
| Standard Deviation (Sample) | 8.8% | 15.9% |
| Standard Deviation (Population) | 8.5% | 15.8% |
Similar Demographics by Unemployment Among Women with Children Under 6 years
Demographics Similar to New Zealanders by Unemployment Among Women with Children Under 6 years
In terms of unemployment among women with children under 6 years, the demographic groups most similar to New Zealanders are Macedonian (7.2%, a difference of 0.070%), Romanian (7.2%, a difference of 0.11%), Immigrants from Eastern Africa (7.2%, a difference of 0.13%), Albanian (7.2%, a difference of 0.18%), and Immigrants from South Eastern Asia (7.2%, a difference of 0.20%).
| Demographics | Rating | Rank | Unemployment Among Women with Children Under 6 years |
| Immigrants | Zimbabwe | 98.6 /100 | #86 | Exceptional 7.1% |
| Alsatians | 98.4 /100 | #87 | Exceptional 7.1% |
| Immigrants | Hungary | 98.3 /100 | #88 | Exceptional 7.1% |
| Immigrants | Denmark | 98.3 /100 | #89 | Exceptional 7.1% |
| Immigrants | Spain | 98.2 /100 | #90 | Exceptional 7.1% |
| Danes | 98.2 /100 | #91 | Exceptional 7.1% |
| Albanians | 98.0 /100 | #92 | Exceptional 7.2% |
| New Zealanders | 97.8 /100 | #93 | Exceptional 7.2% |
| Macedonians | 97.7 /100 | #94 | Exceptional 7.2% |
| Romanians | 97.7 /100 | #95 | Exceptional 7.2% |
| Immigrants | Eastern Africa | 97.7 /100 | #96 | Exceptional 7.2% |
| Immigrants | South Eastern Asia | 97.6 /100 | #97 | Exceptional 7.2% |
| Russians | 97.5 /100 | #98 | Exceptional 7.2% |
| Immigrants | Europe | 97.5 /100 | #99 | Exceptional 7.2% |
| Immigrants | Northern Europe | 97.4 /100 | #100 | Exceptional 7.2% |
Demographics Similar to Cherokee by Unemployment Among Women with Children Under 6 years
In terms of unemployment among women with children under 6 years, the demographic groups most similar to Cherokee are Fijian (9.3%, a difference of 0.78%), Houma (9.4%, a difference of 0.78%), American (9.3%, a difference of 0.80%), Immigrants from the Azores (9.2%, a difference of 1.2%), and French American Indian (9.2%, a difference of 1.4%).
| Demographics | Rating | Rank | Unemployment Among Women with Children Under 6 years |
| Immigrants | Micronesia | 0.0 /100 | #308 | Tragic 9.1% |
| Africans | 0.0 /100 | #309 | Tragic 9.2% |
| Cajuns | 0.0 /100 | #310 | Tragic 9.2% |
| French American Indians | 0.0 /100 | #311 | Tragic 9.2% |
| Immigrants | Azores | 0.0 /100 | #312 | Tragic 9.2% |
| Americans | 0.0 /100 | #313 | Tragic 9.3% |
| Fijians | 0.0 /100 | #314 | Tragic 9.3% |
| Cherokee | 0.0 /100 | #315 | Tragic 9.3% |
| Houma | 0.0 /100 | #316 | Tragic 9.4% |
| Dutch West Indians | 0.0 /100 | #317 | Tragic 9.5% |
| Osage | 0.0 /100 | #318 | Tragic 9.5% |
| Marshallese | 0.0 /100 | #319 | Tragic 9.6% |
| Potawatomi | 0.0 /100 | #320 | Tragic 9.6% |
| Central American Indians | 0.0 /100 | #321 | Tragic 9.6% |
| Alaska Natives | 0.0 /100 | #322 | Tragic 9.6% |