Navajo vs Immigrants from Guyana Unemployment Among Ages 55 to 59 years
COMPARE
Navajo
Immigrants from Guyana
Unemployment Among Ages 55 to 59 years
Unemployment Among Ages 55 to 59 years Comparison
Navajo
Immigrants from Guyana
6.7%
UNEMPLOYMENT AMONG AGES 55 TO 59 YEARS
0.0/ 100
METRIC RATING
336th/ 347
METRIC RANK
5.8%
UNEMPLOYMENT AMONG AGES 55 TO 59 YEARS
0.0/ 100
METRIC RATING
318th/ 347
METRIC RANK
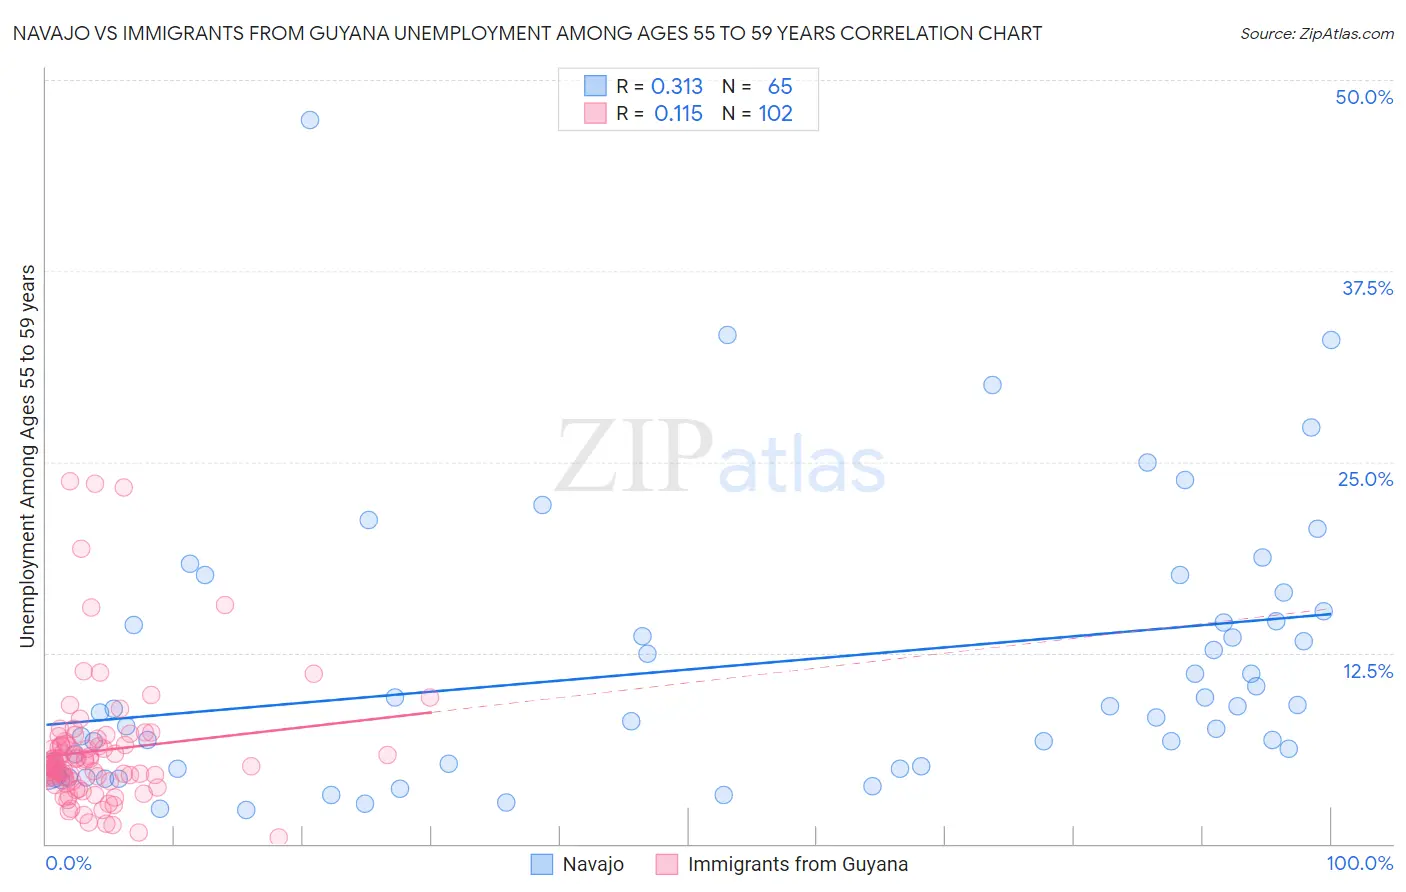
Navajo vs Immigrants from Guyana Unemployment Among Ages 55 to 59 years Correlation Chart
The statistical analysis conducted on geographies consisting of 212,930,605 people shows a mild positive correlation between the proportion of Navajo and unemployment rate among population between the ages 55 and 59 in the United States with a correlation coefficient (R) of 0.313 and weighted average of 6.7%. Similarly, the statistical analysis conducted on geographies consisting of 177,061,395 people shows a poor positive correlation between the proportion of Immigrants from Guyana and unemployment rate among population between the ages 55 and 59 in the United States with a correlation coefficient (R) of 0.115 and weighted average of 5.8%, a difference of 17.0%.
Unemployment Among Ages 55 to 59 years Correlation Summary
| Measurement | Navajo | Immigrants from Guyana |
| Minimum | 2.2% | 0.40% |
| Maximum | 47.4% | 23.7% |
| Range | 45.2% | 23.3% |
| Mean | 11.6% | 6.1% |
| Median | 8.8% | 5.2% |
| Interquartile 25% (IQ1) | 4.9% | 4.3% |
| Interquartile 75% (IQ3) | 14.9% | 6.5% |
| Interquartile Range (IQR) | 10.0% | 2.2% |
| Standard Deviation (Sample) | 8.9% | 4.2% |
| Standard Deviation (Population) | 8.9% | 4.2% |
Demographics Similar to Navajo and Immigrants from Guyana by Unemployment Among Ages 55 to 59 years
In terms of unemployment among ages 55 to 59 years, the demographic groups most similar to Navajo are Colville (6.7%, a difference of 0.15%), Pueblo (6.7%, a difference of 0.33%), Paiute (6.8%, a difference of 0.52%), Pima (6.6%, a difference of 1.6%), and Aleut (6.4%, a difference of 4.4%). Similarly, the demographic groups most similar to Immigrants from Guyana are Kiowa (5.8%, a difference of 0.020%), Immigrants from the Azores (5.8%, a difference of 0.27%), Hmong (5.7%, a difference of 0.93%), Chippewa (5.9%, a difference of 2.1%), and Crow (5.9%, a difference of 2.2%).
| Demographics | Rating | Rank | Unemployment Among Ages 55 to 59 years |
| Hmong | 0.0 /100 | #317 | Tragic 5.7% |
| Immigrants | Guyana | 0.0 /100 | #318 | Tragic 5.8% |
| Kiowa | 0.0 /100 | #319 | Tragic 5.8% |
| Immigrants | Azores | 0.0 /100 | #320 | Tragic 5.8% |
| Chippewa | 0.0 /100 | #321 | Tragic 5.9% |
| Crow | 0.0 /100 | #322 | Tragic 5.9% |
| Immigrants | Bangladesh | 0.0 /100 | #323 | Tragic 5.9% |
| Vietnamese | 0.0 /100 | #324 | Tragic 5.9% |
| Immigrants | Armenia | 0.0 /100 | #325 | Tragic 6.0% |
| Natives/Alaskans | 0.0 /100 | #326 | Tragic 6.0% |
| Arapaho | 0.0 /100 | #327 | Tragic 6.1% |
| Yuman | 0.0 /100 | #328 | Tragic 6.1% |
| Dominicans | 0.0 /100 | #329 | Tragic 6.2% |
| Alaska Natives | 0.0 /100 | #330 | Tragic 6.2% |
| Immigrants | Dominican Republic | 0.0 /100 | #331 | Tragic 6.3% |
| Aleuts | 0.0 /100 | #332 | Tragic 6.4% |
| Pima | 0.0 /100 | #333 | Tragic 6.6% |
| Pueblo | 0.0 /100 | #334 | Tragic 6.7% |
| Colville | 0.0 /100 | #335 | Tragic 6.7% |
| Navajo | 0.0 /100 | #336 | Tragic 6.7% |
| Paiute | 0.0 /100 | #337 | Tragic 6.8% |