Serbian vs Lebanese Unemployment Among Ages 55 to 59 years
COMPARE
Serbian
Lebanese
Unemployment Among Ages 55 to 59 years
Unemployment Among Ages 55 to 59 years Comparison
Serbians
Lebanese
4.7%
UNEMPLOYMENT AMONG AGES 55 TO 59 YEARS
94.4/ 100
METRIC RATING
100th/ 347
METRIC RANK
4.6%
UNEMPLOYMENT AMONG AGES 55 TO 59 YEARS
97.5/ 100
METRIC RATING
83rd/ 347
METRIC RANK
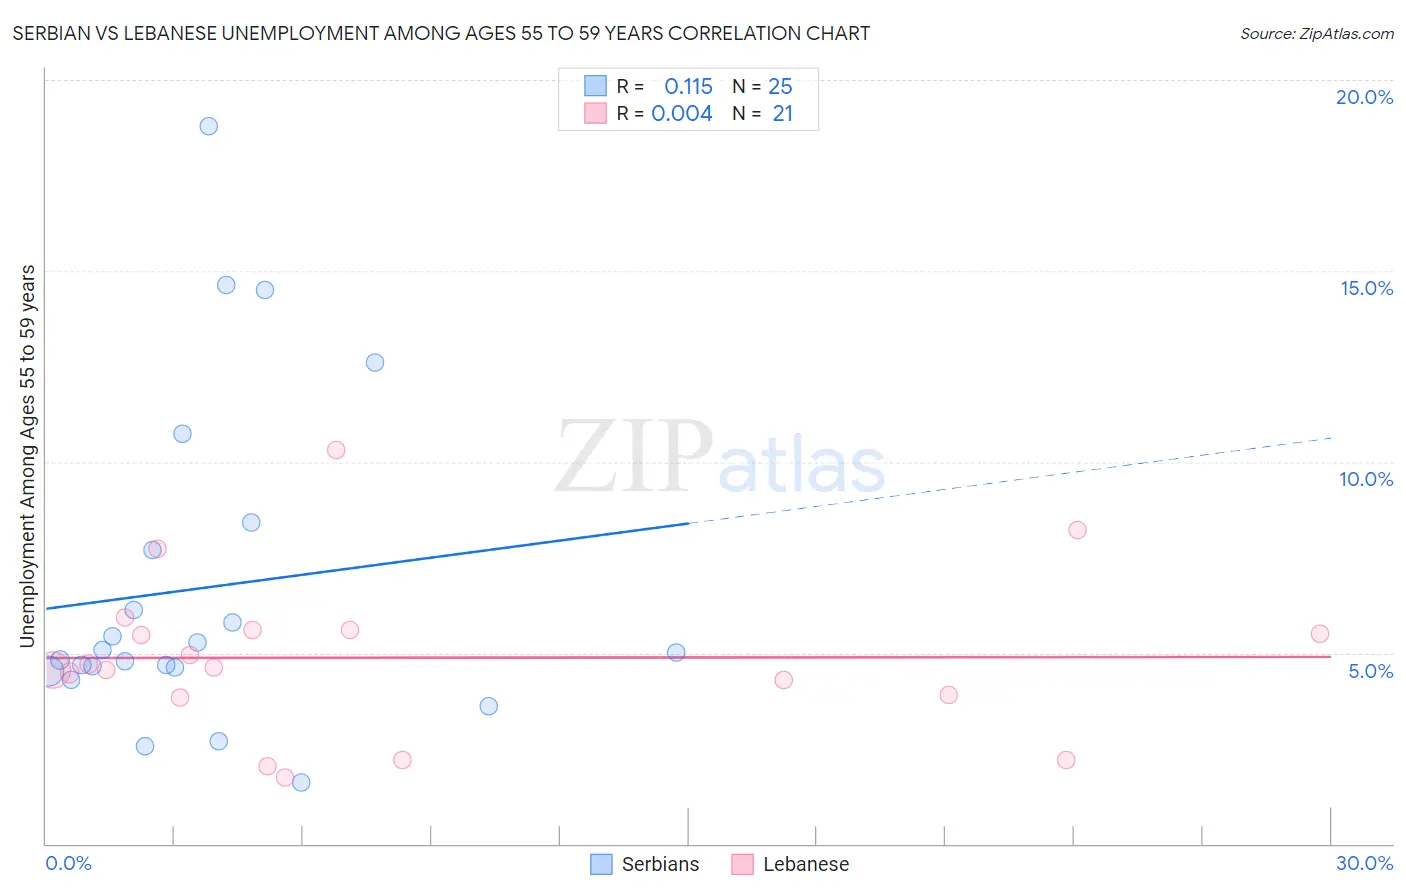
Serbian vs Lebanese Unemployment Among Ages 55 to 59 years Correlation Chart
The statistical analysis conducted on geographies consisting of 254,232,562 people shows a poor positive correlation between the proportion of Serbians and unemployment rate among population between the ages 55 and 59 in the United States with a correlation coefficient (R) of 0.115 and weighted average of 4.7%. Similarly, the statistical analysis conducted on geographies consisting of 373,432,336 people shows no correlation between the proportion of Lebanese and unemployment rate among population between the ages 55 and 59 in the United States with a correlation coefficient (R) of 0.004 and weighted average of 4.6%, a difference of 0.91%.
Unemployment Among Ages 55 to 59 years Correlation Summary
| Measurement | Serbian | Lebanese |
| Minimum | 1.6% | 1.7% |
| Maximum | 18.8% | 10.3% |
| Range | 17.2% | 8.6% |
| Mean | 6.7% | 4.9% |
| Median | 5.0% | 4.6% |
| Interquartile 25% (IQ1) | 4.6% | 3.9% |
| Interquartile 75% (IQ3) | 8.0% | 5.6% |
| Interquartile Range (IQR) | 3.5% | 1.7% |
| Standard Deviation (Sample) | 4.3% | 2.1% |
| Standard Deviation (Population) | 4.2% | 2.0% |
Demographics Similar to Serbians and Lebanese by Unemployment Among Ages 55 to 59 years
In terms of unemployment among ages 55 to 59 years, the demographic groups most similar to Serbians are Celtic (4.7%, a difference of 0.010%), Yugoslavian (4.7%, a difference of 0.070%), Immigrants from Germany (4.7%, a difference of 0.090%), Immigrants from Canada (4.7%, a difference of 0.11%), and Immigrants from Belgium (4.7%, a difference of 0.12%). Similarly, the demographic groups most similar to Lebanese are Latvian (4.6%, a difference of 0.12%), Taiwanese (4.6%, a difference of 0.17%), Malaysian (4.7%, a difference of 0.24%), Immigrants from Vietnam (4.7%, a difference of 0.24%), and Immigrants from Colombia (4.7%, a difference of 0.24%).
| Demographics | Rating | Rank | Unemployment Among Ages 55 to 59 years |
| Taiwanese | 97.9 /100 | #81 | Exceptional 4.6% |
| Latvians | 97.8 /100 | #82 | Exceptional 4.6% |
| Lebanese | 97.5 /100 | #83 | Exceptional 4.6% |
| Malaysians | 96.9 /100 | #84 | Exceptional 4.7% |
| Immigrants | Vietnam | 96.9 /100 | #85 | Exceptional 4.7% |
| Immigrants | Colombia | 96.9 /100 | #86 | Exceptional 4.7% |
| Poles | 96.9 /100 | #87 | Exceptional 4.7% |
| Immigrants | Cameroon | 96.9 /100 | #88 | Exceptional 4.7% |
| Irish | 96.8 /100 | #89 | Exceptional 4.7% |
| Immigrants | Poland | 96.4 /100 | #90 | Exceptional 4.7% |
| New Zealanders | 96.3 /100 | #91 | Exceptional 4.7% |
| Iraqis | 96.1 /100 | #92 | Exceptional 4.7% |
| Immigrants | England | 95.8 /100 | #93 | Exceptional 4.7% |
| Immigrants | Scotland | 95.7 /100 | #94 | Exceptional 4.7% |
| South Africans | 95.6 /100 | #95 | Exceptional 4.7% |
| Immigrants | Belgium | 95.0 /100 | #96 | Exceptional 4.7% |
| Immigrants | Canada | 94.9 /100 | #97 | Exceptional 4.7% |
| Immigrants | Germany | 94.8 /100 | #98 | Exceptional 4.7% |
| Yugoslavians | 94.7 /100 | #99 | Exceptional 4.7% |
| Serbians | 94.4 /100 | #100 | Exceptional 4.7% |
| Celtics | 94.3 /100 | #101 | Exceptional 4.7% |