Immigrants from Japan vs Immigrants from Guyana Unemployment Among Ages 55 to 59 years
COMPARE
Immigrants from Japan
Immigrants from Guyana
Unemployment Among Ages 55 to 59 years
Unemployment Among Ages 55 to 59 years Comparison
Immigrants from Japan
Immigrants from Guyana
4.7%
UNEMPLOYMENT AMONG AGES 55 TO 59 YEARS
89.4/ 100
METRIC RATING
123rd/ 347
METRIC RANK
5.8%
UNEMPLOYMENT AMONG AGES 55 TO 59 YEARS
0.0/ 100
METRIC RATING
318th/ 347
METRIC RANK
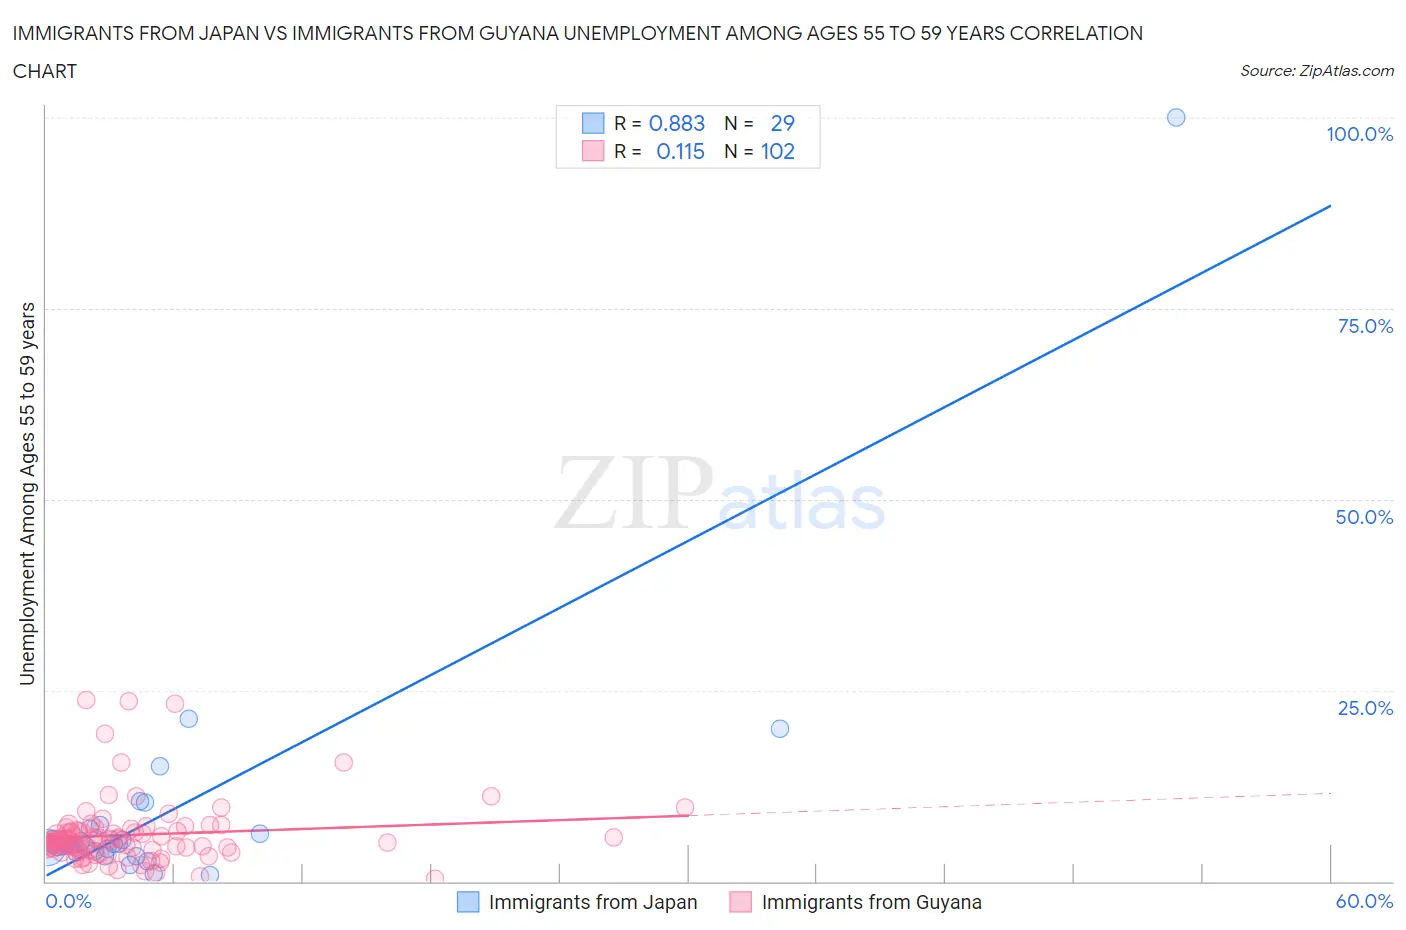
Immigrants from Japan vs Immigrants from Guyana Unemployment Among Ages 55 to 59 years Correlation Chart
The statistical analysis conducted on geographies consisting of 320,972,044 people shows a very strong positive correlation between the proportion of Immigrants from Japan and unemployment rate among population between the ages 55 and 59 in the United States with a correlation coefficient (R) of 0.883 and weighted average of 4.7%. Similarly, the statistical analysis conducted on geographies consisting of 177,061,395 people shows a poor positive correlation between the proportion of Immigrants from Guyana and unemployment rate among population between the ages 55 and 59 in the United States with a correlation coefficient (R) of 0.115 and weighted average of 5.8%, a difference of 21.9%.
Unemployment Among Ages 55 to 59 years Correlation Summary
| Measurement | Immigrants from Japan | Immigrants from Guyana |
| Minimum | 0.90% | 0.40% |
| Maximum | 100.0% | 23.7% |
| Range | 99.1% | 23.3% |
| Mean | 9.5% | 6.1% |
| Median | 4.8% | 5.2% |
| Interquartile 25% (IQ1) | 3.9% | 4.3% |
| Interquartile 75% (IQ3) | 7.1% | 6.5% |
| Interquartile Range (IQR) | 3.2% | 2.2% |
| Standard Deviation (Sample) | 18.1% | 4.2% |
| Standard Deviation (Population) | 17.8% | 4.2% |
Similar Demographics by Unemployment Among Ages 55 to 59 years
Demographics Similar to Immigrants from Japan by Unemployment Among Ages 55 to 59 years
In terms of unemployment among ages 55 to 59 years, the demographic groups most similar to Immigrants from Japan are Immigrants from Afghanistan (4.7%, a difference of 0.010%), Pakistani (4.7%, a difference of 0.030%), Immigrants from South Africa (4.7%, a difference of 0.050%), Lithuanian (4.7%, a difference of 0.060%), and Immigrants from Chile (4.7%, a difference of 0.15%).
| Demographics | Rating | Rank | Unemployment Among Ages 55 to 59 years |
| Turks | 90.9 /100 | #116 | Exceptional 4.7% |
| Asians | 90.8 /100 | #117 | Exceptional 4.7% |
| Immigrants | Chile | 90.7 /100 | #118 | Exceptional 4.7% |
| Whites/Caucasians | 90.7 /100 | #119 | Exceptional 4.7% |
| Immigrants | South Africa | 89.9 /100 | #120 | Excellent 4.7% |
| Pakistanis | 89.7 /100 | #121 | Excellent 4.7% |
| Immigrants | Afghanistan | 89.5 /100 | #122 | Excellent 4.7% |
| Immigrants | Japan | 89.4 /100 | #123 | Excellent 4.7% |
| Lithuanians | 88.8 /100 | #124 | Excellent 4.7% |
| Immigrants | Malaysia | 87.9 /100 | #125 | Excellent 4.7% |
| Immigrants | Serbia | 87.8 /100 | #126 | Excellent 4.7% |
| Icelanders | 87.7 /100 | #127 | Excellent 4.7% |
| Pennsylvania Germans | 87.1 /100 | #128 | Excellent 4.7% |
| Immigrants | Sweden | 86.8 /100 | #129 | Excellent 4.7% |
| Greeks | 86.6 /100 | #130 | Excellent 4.7% |
Demographics Similar to Immigrants from Guyana by Unemployment Among Ages 55 to 59 years
In terms of unemployment among ages 55 to 59 years, the demographic groups most similar to Immigrants from Guyana are Kiowa (5.8%, a difference of 0.020%), Immigrants from the Azores (5.8%, a difference of 0.27%), Hmong (5.7%, a difference of 0.93%), Immigrants from Ecuador (5.7%, a difference of 1.2%), and Guyanese (5.7%, a difference of 1.4%).
| Demographics | Rating | Rank | Unemployment Among Ages 55 to 59 years |
| Houma | 0.0 /100 | #311 | Tragic 5.6% |
| Ecuadorians | 0.0 /100 | #312 | Tragic 5.6% |
| Central American Indians | 0.0 /100 | #313 | Tragic 5.6% |
| Tlingit-Haida | 0.0 /100 | #314 | Tragic 5.7% |
| Guyanese | 0.0 /100 | #315 | Tragic 5.7% |
| Immigrants | Ecuador | 0.0 /100 | #316 | Tragic 5.7% |
| Hmong | 0.0 /100 | #317 | Tragic 5.7% |
| Immigrants | Guyana | 0.0 /100 | #318 | Tragic 5.8% |
| Kiowa | 0.0 /100 | #319 | Tragic 5.8% |
| Immigrants | Azores | 0.0 /100 | #320 | Tragic 5.8% |
| Chippewa | 0.0 /100 | #321 | Tragic 5.9% |
| Crow | 0.0 /100 | #322 | Tragic 5.9% |
| Immigrants | Bangladesh | 0.0 /100 | #323 | Tragic 5.9% |
| Vietnamese | 0.0 /100 | #324 | Tragic 5.9% |
| Immigrants | Armenia | 0.0 /100 | #325 | Tragic 6.0% |