Immigrants from Canada vs Immigrants from Guyana Unemployment Among Ages 55 to 59 years
COMPARE
Immigrants from Canada
Immigrants from Guyana
Unemployment Among Ages 55 to 59 years
Unemployment Among Ages 55 to 59 years Comparison
Immigrants from Canada
Immigrants from Guyana
4.7%
UNEMPLOYMENT AMONG AGES 55 TO 59 YEARS
94.9/ 100
METRIC RATING
97th/ 347
METRIC RANK
5.8%
UNEMPLOYMENT AMONG AGES 55 TO 59 YEARS
0.0/ 100
METRIC RATING
318th/ 347
METRIC RANK
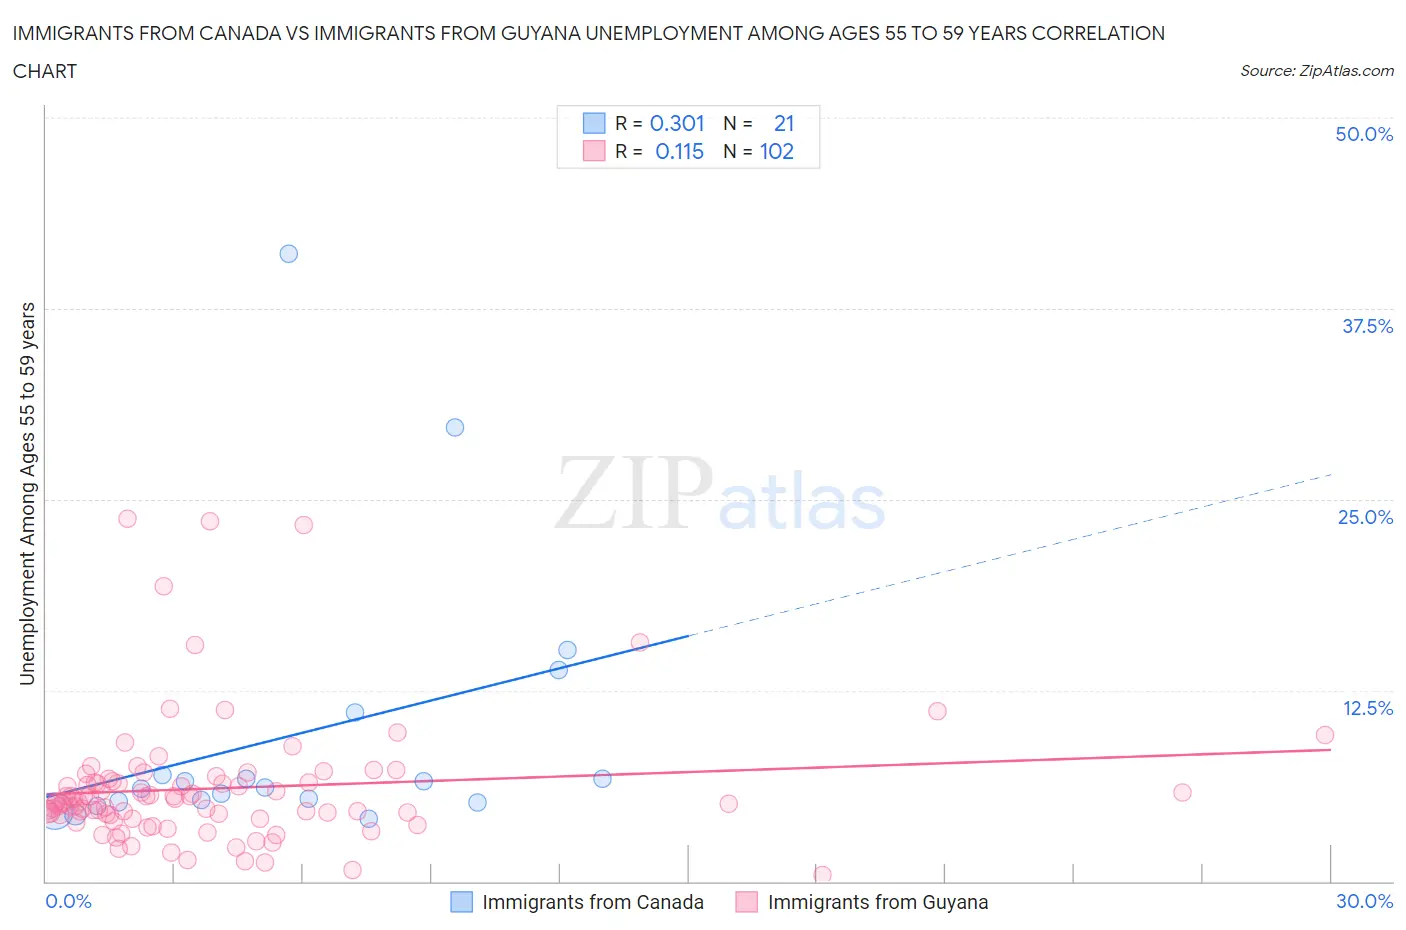
Immigrants from Canada vs Immigrants from Guyana Unemployment Among Ages 55 to 59 years Correlation Chart
The statistical analysis conducted on geographies consisting of 417,489,457 people shows a mild positive correlation between the proportion of Immigrants from Canada and unemployment rate among population between the ages 55 and 59 in the United States with a correlation coefficient (R) of 0.301 and weighted average of 4.7%. Similarly, the statistical analysis conducted on geographies consisting of 177,061,395 people shows a poor positive correlation between the proportion of Immigrants from Guyana and unemployment rate among population between the ages 55 and 59 in the United States with a correlation coefficient (R) of 0.115 and weighted average of 5.8%, a difference of 22.9%.
Unemployment Among Ages 55 to 59 years Correlation Summary
| Measurement | Immigrants from Canada | Immigrants from Guyana |
| Minimum | 4.1% | 0.40% |
| Maximum | 41.1% | 23.7% |
| Range | 37.0% | 23.3% |
| Mean | 9.6% | 6.1% |
| Median | 6.1% | 5.2% |
| Interquartile 25% (IQ1) | 5.2% | 4.3% |
| Interquartile 75% (IQ3) | 9.0% | 6.5% |
| Interquartile Range (IQR) | 3.8% | 2.2% |
| Standard Deviation (Sample) | 9.2% | 4.2% |
| Standard Deviation (Population) | 9.0% | 4.2% |
Similar Demographics by Unemployment Among Ages 55 to 59 years
Demographics Similar to Immigrants from Canada by Unemployment Among Ages 55 to 59 years
In terms of unemployment among ages 55 to 59 years, the demographic groups most similar to Immigrants from Canada are Immigrants from Belgium (4.7%, a difference of 0.010%), Immigrants from Germany (4.7%, a difference of 0.010%), Yugoslavian (4.7%, a difference of 0.040%), Serbian (4.7%, a difference of 0.11%), and Celtic (4.7%, a difference of 0.12%).
| Demographics | Rating | Rank | Unemployment Among Ages 55 to 59 years |
| Immigrants | Poland | 96.4 /100 | #90 | Exceptional 4.7% |
| New Zealanders | 96.3 /100 | #91 | Exceptional 4.7% |
| Iraqis | 96.1 /100 | #92 | Exceptional 4.7% |
| Immigrants | England | 95.8 /100 | #93 | Exceptional 4.7% |
| Immigrants | Scotland | 95.7 /100 | #94 | Exceptional 4.7% |
| South Africans | 95.6 /100 | #95 | Exceptional 4.7% |
| Immigrants | Belgium | 95.0 /100 | #96 | Exceptional 4.7% |
| Immigrants | Canada | 94.9 /100 | #97 | Exceptional 4.7% |
| Immigrants | Germany | 94.8 /100 | #98 | Exceptional 4.7% |
| Yugoslavians | 94.7 /100 | #99 | Exceptional 4.7% |
| Serbians | 94.4 /100 | #100 | Exceptional 4.7% |
| Celtics | 94.3 /100 | #101 | Exceptional 4.7% |
| Canadians | 94.1 /100 | #102 | Exceptional 4.7% |
| Immigrants | Oceania | 94.0 /100 | #103 | Exceptional 4.7% |
| Immigrants | Turkey | 93.9 /100 | #104 | Exceptional 4.7% |
Demographics Similar to Immigrants from Guyana by Unemployment Among Ages 55 to 59 years
In terms of unemployment among ages 55 to 59 years, the demographic groups most similar to Immigrants from Guyana are Kiowa (5.8%, a difference of 0.020%), Immigrants from the Azores (5.8%, a difference of 0.27%), Hmong (5.7%, a difference of 0.93%), Immigrants from Ecuador (5.7%, a difference of 1.2%), and Guyanese (5.7%, a difference of 1.4%).
| Demographics | Rating | Rank | Unemployment Among Ages 55 to 59 years |
| Houma | 0.0 /100 | #311 | Tragic 5.6% |
| Ecuadorians | 0.0 /100 | #312 | Tragic 5.6% |
| Central American Indians | 0.0 /100 | #313 | Tragic 5.6% |
| Tlingit-Haida | 0.0 /100 | #314 | Tragic 5.7% |
| Guyanese | 0.0 /100 | #315 | Tragic 5.7% |
| Immigrants | Ecuador | 0.0 /100 | #316 | Tragic 5.7% |
| Hmong | 0.0 /100 | #317 | Tragic 5.7% |
| Immigrants | Guyana | 0.0 /100 | #318 | Tragic 5.8% |
| Kiowa | 0.0 /100 | #319 | Tragic 5.8% |
| Immigrants | Azores | 0.0 /100 | #320 | Tragic 5.8% |
| Chippewa | 0.0 /100 | #321 | Tragic 5.9% |
| Crow | 0.0 /100 | #322 | Tragic 5.9% |
| Immigrants | Bangladesh | 0.0 /100 | #323 | Tragic 5.9% |
| Vietnamese | 0.0 /100 | #324 | Tragic 5.9% |
| Immigrants | Armenia | 0.0 /100 | #325 | Tragic 6.0% |