Navajo vs Immigrants from Dominican Republic 12th Grade, No Diploma
COMPARE
Navajo
Immigrants from Dominican Republic
12th Grade, No Diploma
12th Grade, No Diploma Comparison
Navajo
Immigrants from Dominican Republic
87.1%
12TH GRADE, NO DIPLOMA
0.0/ 100
METRIC RATING
317th/ 347
METRIC RANK
84.9%
12TH GRADE, NO DIPLOMA
0.0/ 100
METRIC RATING
334th/ 347
METRIC RANK
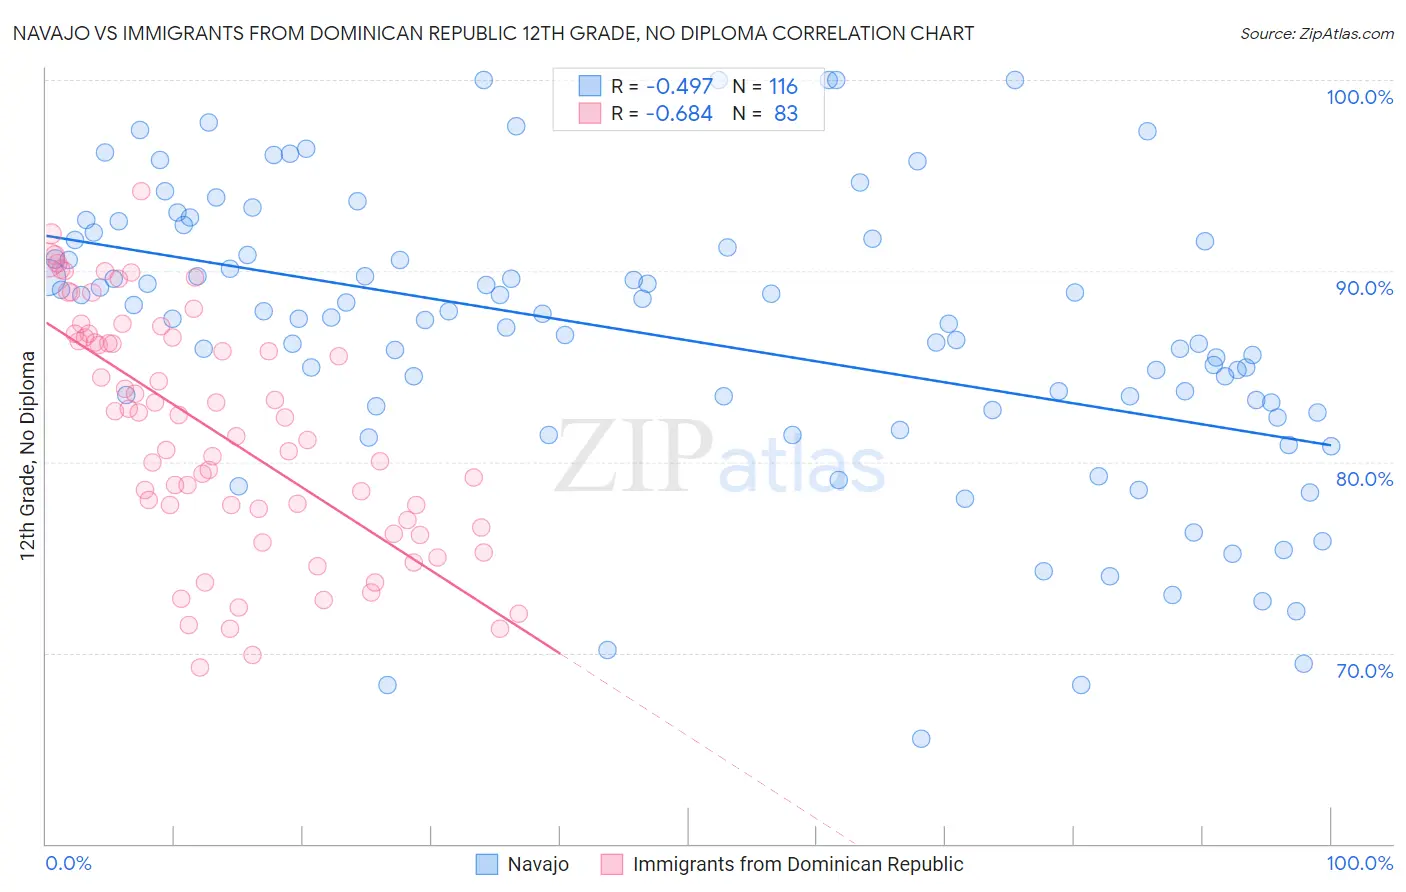
Navajo vs Immigrants from Dominican Republic 12th Grade, No Diploma Correlation Chart
The statistical analysis conducted on geographies consisting of 224,872,856 people shows a moderate negative correlation between the proportion of Navajo and percentage of population with at least 12th grade (no diploma) education in the United States with a correlation coefficient (R) of -0.497 and weighted average of 87.1%. Similarly, the statistical analysis conducted on geographies consisting of 275,144,349 people shows a significant negative correlation between the proportion of Immigrants from Dominican Republic and percentage of population with at least 12th grade (no diploma) education in the United States with a correlation coefficient (R) of -0.684 and weighted average of 84.9%, a difference of 2.6%.
12th Grade, No Diploma Correlation Summary
| Measurement | Navajo | Immigrants from Dominican Republic |
| Minimum | 65.5% | 69.2% |
| Maximum | 100.0% | 94.2% |
| Range | 34.5% | 25.0% |
| Mean | 86.6% | 81.6% |
| Median | 87.5% | 82.3% |
| Interquartile 25% (IQ1) | 82.8% | 77.0% |
| Interquartile 75% (IQ3) | 91.4% | 86.5% |
| Interquartile Range (IQR) | 8.6% | 9.5% |
| Standard Deviation (Sample) | 7.5% | 6.2% |
| Standard Deviation (Population) | 7.5% | 6.1% |
Demographics Similar to Navajo and Immigrants from Dominican Republic by 12th Grade, No Diploma
In terms of 12th grade, no diploma, the demographic groups most similar to Navajo are Belizean (87.0%, a difference of 0.060%), Immigrants from Belize (87.0%, a difference of 0.14%), Apache (87.3%, a difference of 0.28%), Nicaraguan (87.3%, a difference of 0.30%), and Immigrants from Nicaragua (86.6%, a difference of 0.61%). Similarly, the demographic groups most similar to Immigrants from Dominican Republic are Immigrants from Yemen (84.8%, a difference of 0.040%), Immigrants from Latin America (85.0%, a difference of 0.14%), Immigrants from Honduras (85.0%, a difference of 0.21%), Central American (85.2%, a difference of 0.42%), and Immigrants from the Azores (85.3%, a difference of 0.56%).
| Demographics | Rating | Rank | 12th Grade, No Diploma |
| Nicaraguans | 0.0 /100 | #315 | Tragic 87.3% |
| Apache | 0.0 /100 | #316 | Tragic 87.3% |
| Navajo | 0.0 /100 | #317 | Tragic 87.1% |
| Belizeans | 0.0 /100 | #318 | Tragic 87.0% |
| Immigrants | Belize | 0.0 /100 | #319 | Tragic 87.0% |
| Immigrants | Nicaragua | 0.0 /100 | #320 | Tragic 86.6% |
| Puerto Ricans | 0.0 /100 | #321 | Tragic 86.5% |
| Central American Indians | 0.0 /100 | #322 | Tragic 86.5% |
| Yuman | 0.0 /100 | #323 | Tragic 86.5% |
| Immigrants | Cabo Verde | 0.0 /100 | #324 | Tragic 85.8% |
| Mexican American Indians | 0.0 /100 | #325 | Tragic 85.7% |
| Dominicans | 0.0 /100 | #326 | Tragic 85.7% |
| Lumbee | 0.0 /100 | #327 | Tragic 85.7% |
| Hondurans | 0.0 /100 | #328 | Tragic 85.5% |
| Hispanics or Latinos | 0.0 /100 | #329 | Tragic 85.4% |
| Immigrants | Azores | 0.0 /100 | #330 | Tragic 85.3% |
| Central Americans | 0.0 /100 | #331 | Tragic 85.2% |
| Immigrants | Honduras | 0.0 /100 | #332 | Tragic 85.0% |
| Immigrants | Latin America | 0.0 /100 | #333 | Tragic 85.0% |
| Immigrants | Dominican Republic | 0.0 /100 | #334 | Tragic 84.9% |
| Immigrants | Yemen | 0.0 /100 | #335 | Tragic 84.8% |