Native/Alaskan vs Immigrants from Haiti Unemployment Among Ages 20 to 24 years
COMPARE
Native/Alaskan
Immigrants from Haiti
Unemployment Among Ages 20 to 24 years
Unemployment Among Ages 20 to 24 years Comparison
Natives/Alaskans
Immigrants from Haiti
13.0%
UNEMPLOYMENT AMONG AGES 20 TO 24 YEARS
0.0/ 100
METRIC RATING
322nd/ 347
METRIC RANK
12.4%
UNEMPLOYMENT AMONG AGES 20 TO 24 YEARS
0.0/ 100
METRIC RATING
306th/ 347
METRIC RANK
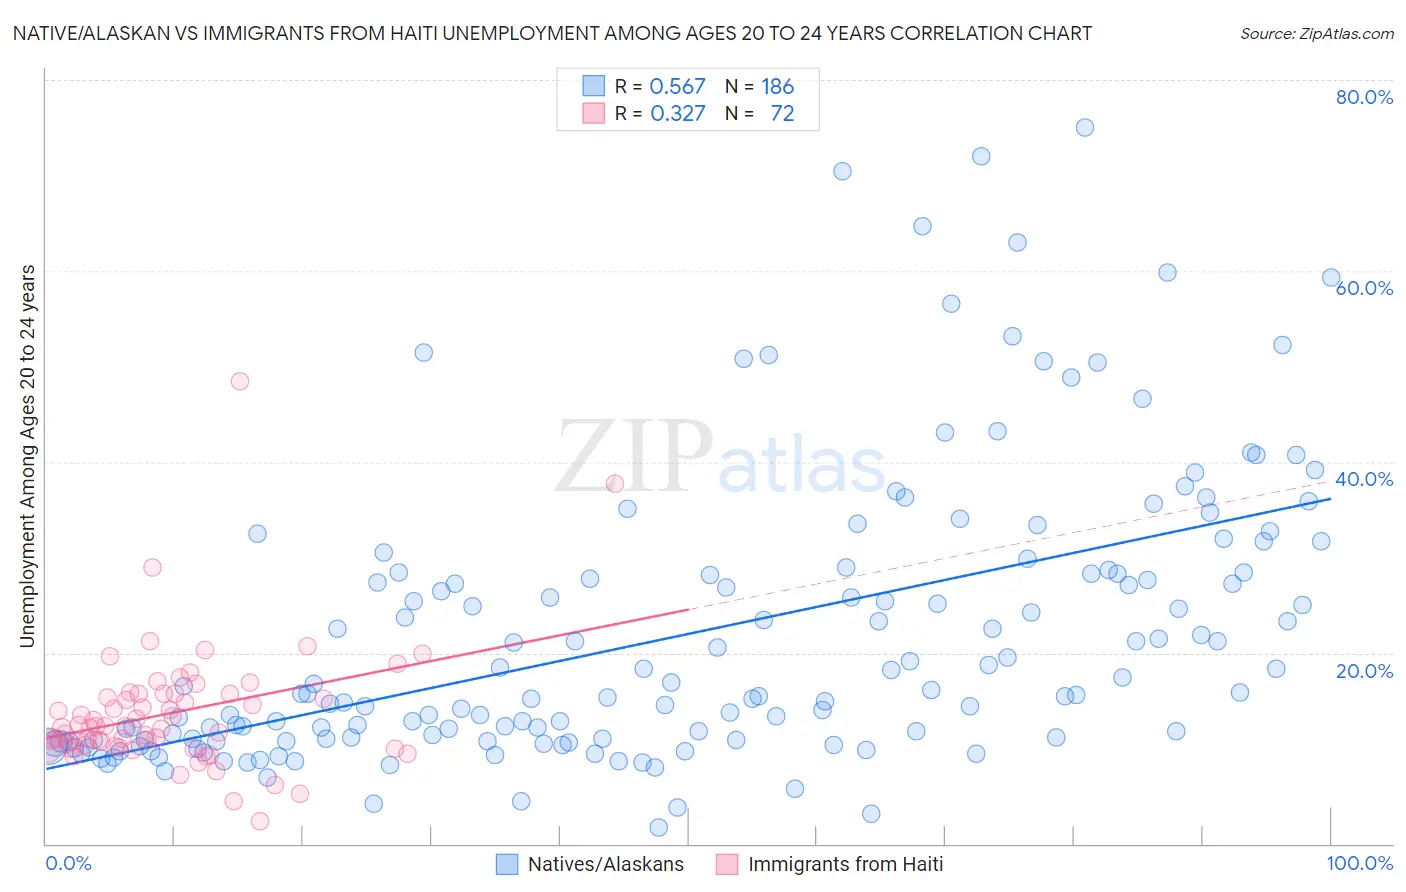
Native/Alaskan vs Immigrants from Haiti Unemployment Among Ages 20 to 24 years Correlation Chart
The statistical analysis conducted on geographies consisting of 484,471,269 people shows a substantial positive correlation between the proportion of Natives/Alaskans and unemployment rate among population between the ages 20 and 24 in the United States with a correlation coefficient (R) of 0.567 and weighted average of 13.0%. Similarly, the statistical analysis conducted on geographies consisting of 220,996,096 people shows a mild positive correlation between the proportion of Immigrants from Haiti and unemployment rate among population between the ages 20 and 24 in the United States with a correlation coefficient (R) of 0.327 and weighted average of 12.4%, a difference of 5.0%.
Unemployment Among Ages 20 to 24 years Correlation Summary
| Measurement | Native/Alaskan | Immigrants from Haiti |
| Minimum | 1.8% | 2.4% |
| Maximum | 75.0% | 48.5% |
| Range | 73.2% | 46.1% |
| Mean | 21.9% | 13.7% |
| Median | 15.7% | 12.2% |
| Interquartile 25% (IQ1) | 10.9% | 10.3% |
| Interquartile 75% (IQ3) | 28.3% | 15.7% |
| Interquartile Range (IQR) | 17.5% | 5.5% |
| Standard Deviation (Sample) | 14.8% | 6.6% |
| Standard Deviation (Population) | 14.8% | 6.6% |
Demographics Similar to Natives/Alaskans and Immigrants from Haiti by Unemployment Among Ages 20 to 24 years
In terms of unemployment among ages 20 to 24 years, the demographic groups most similar to Natives/Alaskans are Immigrants from Jamaica (13.0%, a difference of 0.38%), Cheyenne (13.0%, a difference of 0.47%), Yakama (13.1%, a difference of 0.48%), Trinidadian and Tobagonian (12.9%, a difference of 0.89%), and Barbadian (12.9%, a difference of 1.1%). Similarly, the demographic groups most similar to Immigrants from Haiti are Bermudan (12.5%, a difference of 0.44%), Chippewa (12.3%, a difference of 0.84%), Immigrants from West Indies (12.3%, a difference of 0.88%), Tohono O'odham (12.5%, a difference of 1.1%), and Immigrants from Bangladesh (12.6%, a difference of 1.2%).
| Demographics | Rating | Rank | Unemployment Among Ages 20 to 24 years |
| Immigrants | West Indies | 0.0 /100 | #304 | Tragic 12.3% |
| Chippewa | 0.0 /100 | #305 | Tragic 12.3% |
| Immigrants | Haiti | 0.0 /100 | #306 | Tragic 12.4% |
| Bermudans | 0.0 /100 | #307 | Tragic 12.5% |
| Tohono O'odham | 0.0 /100 | #308 | Tragic 12.5% |
| Immigrants | Bangladesh | 0.0 /100 | #309 | Tragic 12.6% |
| Jamaicans | 0.0 /100 | #310 | Tragic 12.6% |
| Vietnamese | 0.0 /100 | #311 | Tragic 12.6% |
| Houma | 0.0 /100 | #312 | Tragic 12.6% |
| Shoshone | 0.0 /100 | #313 | Tragic 12.7% |
| Blacks/African Americans | 0.0 /100 | #314 | Tragic 12.7% |
| West Indians | 0.0 /100 | #315 | Tragic 12.8% |
| Immigrants | Dominica | 0.0 /100 | #316 | Tragic 12.8% |
| Immigrants | Trinidad and Tobago | 0.0 /100 | #317 | Tragic 12.8% |
| Barbadians | 0.0 /100 | #318 | Tragic 12.9% |
| Trinidadians and Tobagonians | 0.0 /100 | #319 | Tragic 12.9% |
| Cheyenne | 0.0 /100 | #320 | Tragic 13.0% |
| Immigrants | Jamaica | 0.0 /100 | #321 | Tragic 13.0% |
| Natives/Alaskans | 0.0 /100 | #322 | Tragic 13.0% |
| Yakama | 0.0 /100 | #323 | Tragic 13.1% |
| Alaska Natives | 0.0 /100 | #324 | Tragic 13.2% |