Native/Alaskan vs Jordanian Unemployment Among Ages 65 to 74 years
COMPARE
Native/Alaskan
Jordanian
Unemployment Among Ages 65 to 74 years
Unemployment Among Ages 65 to 74 years Comparison
Natives/Alaskans
Jordanians
6.0%
UNEMPLOYMENT AMONG AGES 65 TO 74 YEARS
0.0/ 100
METRIC RATING
326th/ 347
METRIC RANK
5.1%
UNEMPLOYMENT AMONG AGES 65 TO 74 YEARS
99.9/ 100
METRIC RATING
42nd/ 347
METRIC RANK
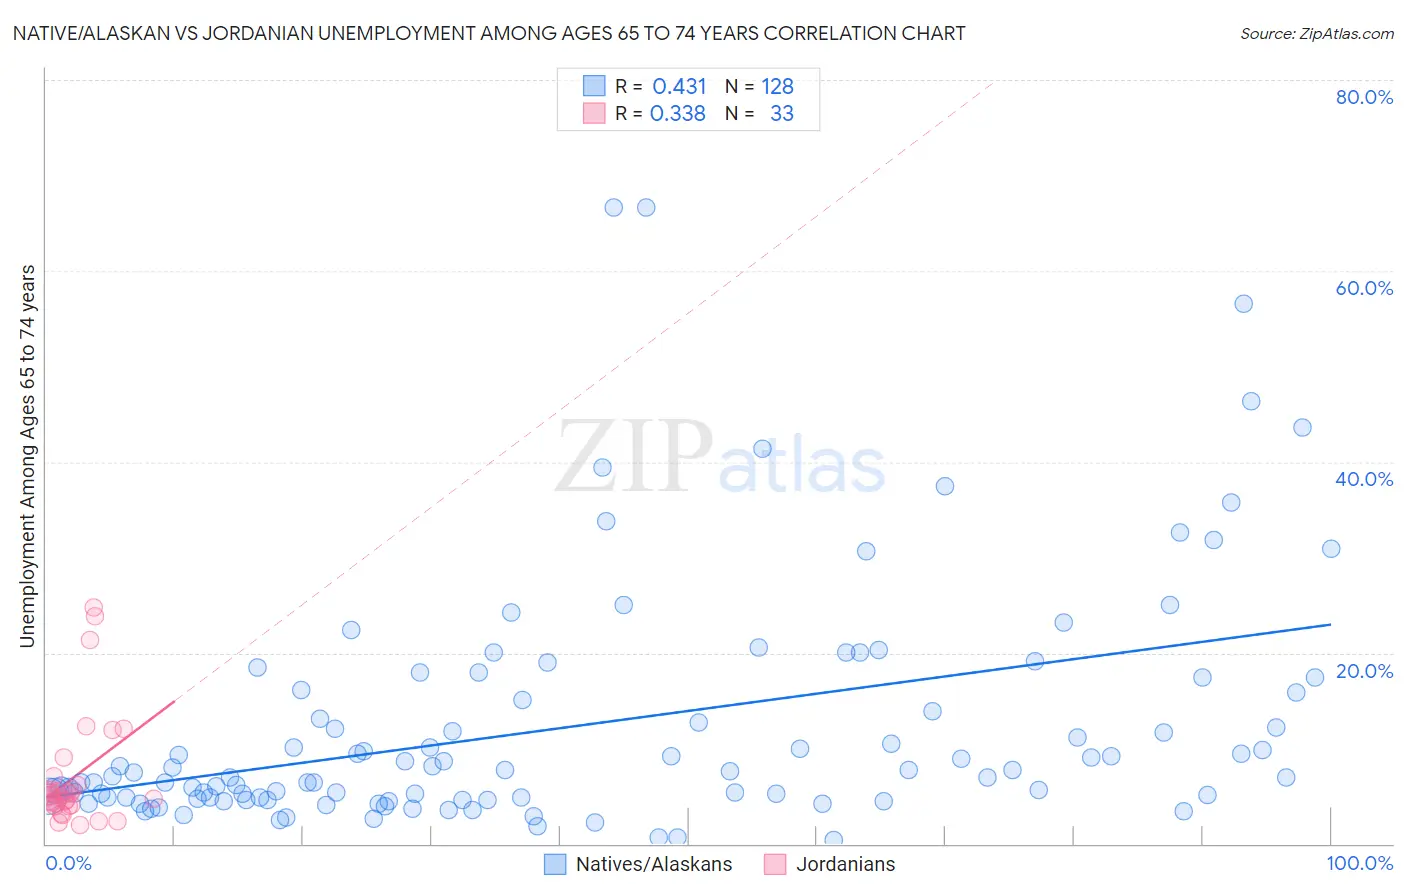
Native/Alaskan vs Jordanian Unemployment Among Ages 65 to 74 years Correlation Chart
The statistical analysis conducted on geographies consisting of 419,713,555 people shows a moderate positive correlation between the proportion of Natives/Alaskans and unemployment rate among population between the ages 65 and 74 in the United States with a correlation coefficient (R) of 0.431 and weighted average of 6.0%. Similarly, the statistical analysis conducted on geographies consisting of 158,389,637 people shows a mild positive correlation between the proportion of Jordanians and unemployment rate among population between the ages 65 and 74 in the United States with a correlation coefficient (R) of 0.338 and weighted average of 5.1%, a difference of 19.4%.
Unemployment Among Ages 65 to 74 years Correlation Summary
| Measurement | Native/Alaskan | Jordanian |
| Minimum | 0.40% | 2.0% |
| Maximum | 66.7% | 24.8% |
| Range | 66.3% | 22.8% |
| Mean | 12.3% | 7.0% |
| Median | 7.6% | 5.0% |
| Interquartile 25% (IQ1) | 4.8% | 4.0% |
| Interquartile 75% (IQ3) | 15.9% | 6.6% |
| Interquartile Range (IQR) | 11.1% | 2.6% |
| Standard Deviation (Sample) | 12.6% | 5.9% |
| Standard Deviation (Population) | 12.6% | 5.8% |
Similar Demographics by Unemployment Among Ages 65 to 74 years
Demographics Similar to Natives/Alaskans by Unemployment Among Ages 65 to 74 years
In terms of unemployment among ages 65 to 74 years, the demographic groups most similar to Natives/Alaskans are Immigrants from Portugal (6.0%, a difference of 0.24%), Tohono O'odham (6.0%, a difference of 0.36%), Delaware (6.0%, a difference of 0.94%), Immigrants from Mexico (6.0%, a difference of 0.99%), and Immigrants from Dominica (6.0%, a difference of 1.2%).
| Demographics | Rating | Rank | Unemployment Among Ages 65 to 74 years |
| Aleuts | 0.0 /100 | #319 | Tragic 5.9% |
| Immigrants | Bahamas | 0.0 /100 | #320 | Tragic 5.9% |
| Immigrants | Dominica | 0.0 /100 | #321 | Tragic 6.0% |
| Immigrants | Mexico | 0.0 /100 | #322 | Tragic 6.0% |
| Delaware | 0.0 /100 | #323 | Tragic 6.0% |
| Tohono O'odham | 0.0 /100 | #324 | Tragic 6.0% |
| Immigrants | Portugal | 0.0 /100 | #325 | Tragic 6.0% |
| Natives/Alaskans | 0.0 /100 | #326 | Tragic 6.0% |
| Shoshone | 0.0 /100 | #327 | Tragic 6.2% |
| Immigrants | Azores | 0.0 /100 | #328 | Tragic 6.2% |
| Yuman | 0.0 /100 | #329 | Tragic 6.2% |
| Dominicans | 0.0 /100 | #330 | Tragic 6.3% |
| Bermudans | 0.0 /100 | #331 | Tragic 6.3% |
| Immigrants | Dominican Republic | 0.0 /100 | #332 | Tragic 6.3% |
| Paiute | 0.0 /100 | #333 | Tragic 6.3% |
Demographics Similar to Jordanians by Unemployment Among Ages 65 to 74 years
In terms of unemployment among ages 65 to 74 years, the demographic groups most similar to Jordanians are Assyrian/Chaldean/Syriac (5.1%, a difference of 0.12%), Ugandan (5.1%, a difference of 0.15%), Immigrants from Iraq (5.1%, a difference of 0.16%), Immigrants from India (5.1%, a difference of 0.21%), and Sioux (5.1%, a difference of 0.32%).
| Demographics | Rating | Rank | Unemployment Among Ages 65 to 74 years |
| Bhutanese | 100.0 /100 | #35 | Exceptional 5.0% |
| Immigrants | Kuwait | 99.9 /100 | #36 | Exceptional 5.0% |
| Immigrants | Eastern Africa | 99.9 /100 | #37 | Exceptional 5.0% |
| Nepalese | 99.9 /100 | #38 | Exceptional 5.0% |
| Immigrants | Sweden | 99.9 /100 | #39 | Exceptional 5.0% |
| Immigrants | Iraq | 99.9 /100 | #40 | Exceptional 5.1% |
| Ugandans | 99.9 /100 | #41 | Exceptional 5.1% |
| Jordanians | 99.9 /100 | #42 | Exceptional 5.1% |
| Assyrians/Chaldeans/Syriacs | 99.9 /100 | #43 | Exceptional 5.1% |
| Immigrants | India | 99.9 /100 | #44 | Exceptional 5.1% |
| Sioux | 99.8 /100 | #45 | Exceptional 5.1% |
| Immigrants | Kenya | 99.8 /100 | #46 | Exceptional 5.1% |
| Immigrants | Uganda | 99.8 /100 | #47 | Exceptional 5.1% |
| Choctaw | 99.8 /100 | #48 | Exceptional 5.1% |
| Immigrants | Austria | 99.8 /100 | #49 | Exceptional 5.1% |