Spanish vs Jordanian Unemployment Among Ages 35 to 44 years
COMPARE
Spanish
Jordanian
Unemployment Among Ages 35 to 44 years
Unemployment Among Ages 35 to 44 years Comparison
Spanish
Jordanians
4.8%
UNEMPLOYMENT AMONG AGES 35 TO 44 YEARS
30.4/ 100
METRIC RATING
193rd/ 347
METRIC RANK
4.3%
UNEMPLOYMENT AMONG AGES 35 TO 44 YEARS
99.0/ 100
METRIC RATING
34th/ 347
METRIC RANK
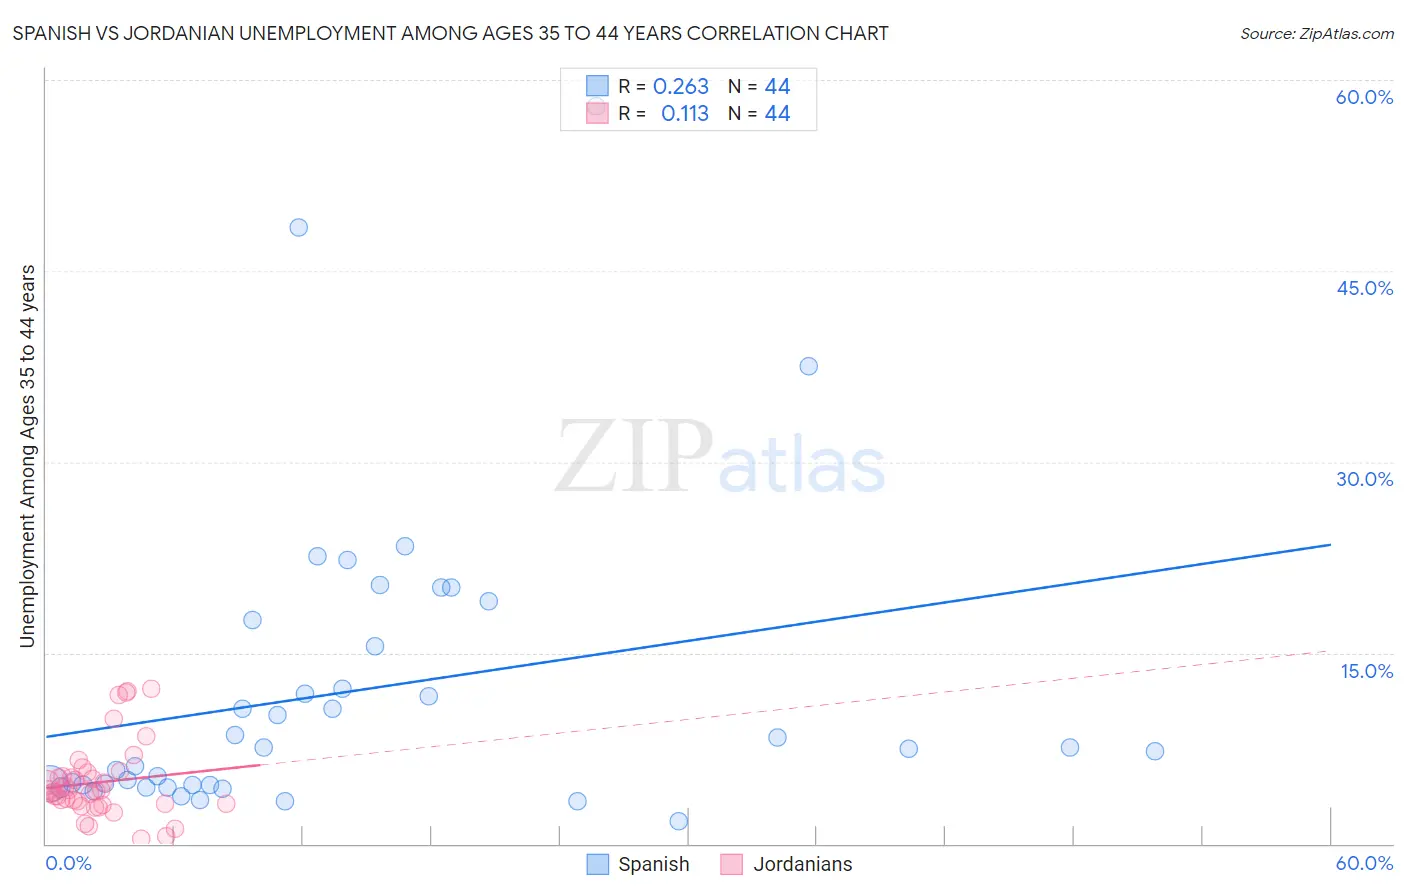
Spanish vs Jordanian Unemployment Among Ages 35 to 44 years Correlation Chart
The statistical analysis conducted on geographies consisting of 410,791,677 people shows a weak positive correlation between the proportion of Spanish and unemployment rate among population between the ages 35 and 44 in the United States with a correlation coefficient (R) of 0.263 and weighted average of 4.8%. Similarly, the statistical analysis conducted on geographies consisting of 165,487,232 people shows a poor positive correlation between the proportion of Jordanians and unemployment rate among population between the ages 35 and 44 in the United States with a correlation coefficient (R) of 0.113 and weighted average of 4.3%, a difference of 10.4%.
Unemployment Among Ages 35 to 44 years Correlation Summary
| Measurement | Spanish | Jordanian |
| Minimum | 1.8% | 0.40% |
| Maximum | 57.9% | 12.2% |
| Range | 56.1% | 11.8% |
| Mean | 12.0% | 4.8% |
| Median | 7.5% | 4.2% |
| Interquartile 25% (IQ1) | 4.6% | 3.1% |
| Interquartile 75% (IQ3) | 16.5% | 5.4% |
| Interquartile Range (IQR) | 11.9% | 2.3% |
| Standard Deviation (Sample) | 11.8% | 2.9% |
| Standard Deviation (Population) | 11.7% | 2.9% |
Similar Demographics by Unemployment Among Ages 35 to 44 years
Demographics Similar to Spanish by Unemployment Among Ages 35 to 44 years
In terms of unemployment among ages 35 to 44 years, the demographic groups most similar to Spanish are Immigrants from Albania (4.8%, a difference of 0.010%), Korean (4.8%, a difference of 0.20%), Bangladeshi (4.8%, a difference of 0.21%), Immigrants from Southern Europe (4.7%, a difference of 0.27%), and Immigrants from South America (4.7%, a difference of 0.27%).
| Demographics | Rating | Rank | Unemployment Among Ages 35 to 44 years |
| Cypriots | 36.5 /100 | #186 | Fair 4.7% |
| Malaysians | 35.5 /100 | #187 | Fair 4.7% |
| Immigrants | Laos | 34.5 /100 | #188 | Fair 4.7% |
| Immigrants | Congo | 33.9 /100 | #189 | Fair 4.7% |
| Immigrants | Southern Europe | 33.8 /100 | #190 | Fair 4.7% |
| Immigrants | South America | 33.8 /100 | #191 | Fair 4.7% |
| Immigrants | Albania | 30.5 /100 | #192 | Fair 4.8% |
| Spanish | 30.4 /100 | #193 | Fair 4.8% |
| Koreans | 28.1 /100 | #194 | Fair 4.8% |
| Bangladeshis | 28.0 /100 | #195 | Fair 4.8% |
| Immigrants | Syria | 23.6 /100 | #196 | Fair 4.8% |
| Immigrants | Oceania | 23.2 /100 | #197 | Fair 4.8% |
| Immigrants | Thailand | 22.9 /100 | #198 | Fair 4.8% |
| Immigrants | Middle Africa | 21.9 /100 | #199 | Fair 4.8% |
| Immigrants | Ukraine | 21.4 /100 | #200 | Fair 4.8% |
Demographics Similar to Jordanians by Unemployment Among Ages 35 to 44 years
In terms of unemployment among ages 35 to 44 years, the demographic groups most similar to Jordanians are Luxembourger (4.3%, a difference of 0.030%), Mongolian (4.3%, a difference of 0.13%), Immigrants from Sri Lanka (4.3%, a difference of 0.15%), Immigrants from Zimbabwe (4.3%, a difference of 0.18%), and Burmese (4.3%, a difference of 0.25%).
| Demographics | Rating | Rank | Unemployment Among Ages 35 to 44 years |
| Assyrians/Chaldeans/Syriacs | 99.3 /100 | #27 | Exceptional 4.3% |
| Immigrants | Japan | 99.3 /100 | #28 | Exceptional 4.3% |
| Europeans | 99.2 /100 | #29 | Exceptional 4.3% |
| Immigrants | Pakistan | 99.2 /100 | #30 | Exceptional 4.3% |
| Carpatho Rusyns | 99.2 /100 | #31 | Exceptional 4.3% |
| Chinese | 99.1 /100 | #32 | Exceptional 4.3% |
| Immigrants | Sri Lanka | 99.1 /100 | #33 | Exceptional 4.3% |
| Jordanians | 99.0 /100 | #34 | Exceptional 4.3% |
| Luxembourgers | 99.0 /100 | #35 | Exceptional 4.3% |
| Mongolians | 98.9 /100 | #36 | Exceptional 4.3% |
| Immigrants | Zimbabwe | 98.9 /100 | #37 | Exceptional 4.3% |
| Burmese | 98.9 /100 | #38 | Exceptional 4.3% |
| Palestinians | 98.8 /100 | #39 | Exceptional 4.3% |
| Zimbabweans | 98.8 /100 | #40 | Exceptional 4.3% |
| Belgians | 98.7 /100 | #41 | Exceptional 4.3% |