American vs Finnish Unemployment Among Ages 30 to 34 years
COMPARE
American
Finnish
Unemployment Among Ages 30 to 34 years
Unemployment Among Ages 30 to 34 years Comparison
Americans
Finns
6.2%
UNEMPLOYMENT AMONG AGES 30 TO 34 YEARS
0.0/ 100
METRIC RATING
265th/ 347
METRIC RANK
5.5%
UNEMPLOYMENT AMONG AGES 30 TO 34 YEARS
30.7/ 100
METRIC RATING
195th/ 347
METRIC RANK
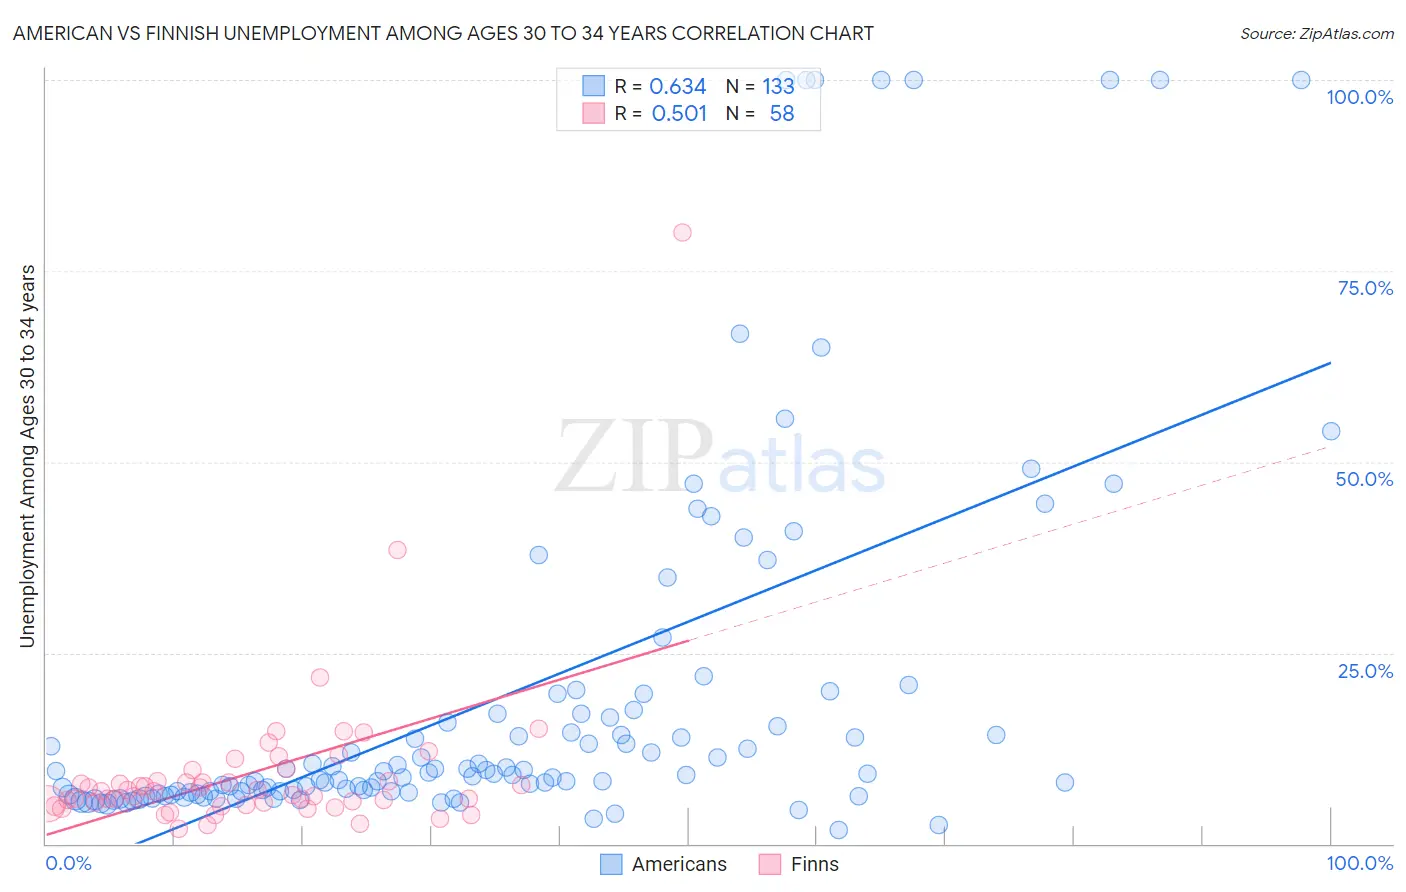
American vs Finnish Unemployment Among Ages 30 to 34 years Correlation Chart
The statistical analysis conducted on geographies consisting of 504,374,959 people shows a significant positive correlation between the proportion of Americans and unemployment rate among population between the ages 30 and 34 in the United States with a correlation coefficient (R) of 0.634 and weighted average of 6.2%. Similarly, the statistical analysis conducted on geographies consisting of 373,300,326 people shows a substantial positive correlation between the proportion of Finns and unemployment rate among population between the ages 30 and 34 in the United States with a correlation coefficient (R) of 0.501 and weighted average of 5.5%, a difference of 12.1%.
Unemployment Among Ages 30 to 34 years Correlation Summary
| Measurement | American | Finnish |
| Minimum | 1.8% | 1.9% |
| Maximum | 100.0% | 80.0% |
| Range | 98.2% | 78.1% |
| Mean | 19.1% | 9.2% |
| Median | 9.1% | 6.9% |
| Interquartile 25% (IQ1) | 6.6% | 5.3% |
| Interquartile 75% (IQ3) | 16.8% | 8.2% |
| Interquartile Range (IQR) | 10.1% | 2.9% |
| Standard Deviation (Sample) | 24.3% | 10.9% |
| Standard Deviation (Population) | 24.2% | 10.8% |
Similar Demographics by Unemployment Among Ages 30 to 34 years
Demographics Similar to Americans by Unemployment Among Ages 30 to 34 years
In terms of unemployment among ages 30 to 34 years, the demographic groups most similar to Americans are Seminole (6.2%, a difference of 0.090%), Chickasaw (6.2%, a difference of 0.11%), Spanish American (6.2%, a difference of 0.15%), Immigrants from Mexico (6.2%, a difference of 0.29%), and Immigrants from Haiti (6.2%, a difference of 0.45%).
| Demographics | Rating | Rank | Unemployment Among Ages 30 to 34 years |
| Mexicans | 0.1 /100 | #258 | Tragic 6.1% |
| Haitians | 0.1 /100 | #259 | Tragic 6.1% |
| Immigrants | Latin America | 0.1 /100 | #260 | Tragic 6.1% |
| Immigrants | Western Africa | 0.1 /100 | #261 | Tragic 6.2% |
| Immigrants | Central America | 0.1 /100 | #262 | Tragic 6.2% |
| Spanish Americans | 0.0 /100 | #263 | Tragic 6.2% |
| Chickasaw | 0.0 /100 | #264 | Tragic 6.2% |
| Americans | 0.0 /100 | #265 | Tragic 6.2% |
| Seminole | 0.0 /100 | #266 | Tragic 6.2% |
| Immigrants | Mexico | 0.0 /100 | #267 | Tragic 6.2% |
| Immigrants | Haiti | 0.0 /100 | #268 | Tragic 6.2% |
| French American Indians | 0.0 /100 | #269 | Tragic 6.3% |
| Immigrants | Senegal | 0.0 /100 | #270 | Tragic 6.3% |
| Comanche | 0.0 /100 | #271 | Tragic 6.3% |
| Blackfeet | 0.0 /100 | #272 | Tragic 6.3% |
Demographics Similar to Finns by Unemployment Among Ages 30 to 34 years
In terms of unemployment among ages 30 to 34 years, the demographic groups most similar to Finns are Slavic (5.5%, a difference of 0.010%), Immigrants from Africa (5.5%, a difference of 0.030%), Moroccan (5.5%, a difference of 0.040%), Irish (5.5%, a difference of 0.050%), and Immigrants from South America (5.5%, a difference of 0.070%).
| Demographics | Rating | Rank | Unemployment Among Ages 30 to 34 years |
| Immigrants | Norway | 36.1 /100 | #188 | Fair 5.5% |
| Immigrants | England | 35.7 /100 | #189 | Fair 5.5% |
| Immigrants | Kazakhstan | 33.9 /100 | #190 | Fair 5.5% |
| Irish | 31.3 /100 | #191 | Fair 5.5% |
| Moroccans | 31.2 /100 | #192 | Fair 5.5% |
| Immigrants | Africa | 31.0 /100 | #193 | Fair 5.5% |
| Slavs | 30.9 /100 | #194 | Fair 5.5% |
| Finns | 30.7 /100 | #195 | Fair 5.5% |
| Immigrants | South America | 29.8 /100 | #196 | Fair 5.5% |
| Immigrants | Nicaragua | 28.9 /100 | #197 | Fair 5.5% |
| Immigrants | Afghanistan | 27.2 /100 | #198 | Fair 5.6% |
| Nicaraguans | 26.6 /100 | #199 | Fair 5.6% |
| Immigrants | Southern Europe | 25.8 /100 | #200 | Fair 5.6% |
| South American Indians | 24.4 /100 | #201 | Fair 5.6% |
| Immigrants | Germany | 22.9 /100 | #202 | Fair 5.6% |