Immigrants from Somalia vs Lumbee Unemployment
COMPARE
Immigrants from Somalia
Lumbee
Unemployment
Unemployment Comparison
Immigrants from Somalia
Lumbee
5.3%
UNEMPLOYMENT
33.8/ 100
METRIC RATING
193rd/ 347
METRIC RANK
6.4%
UNEMPLOYMENT
0.0/ 100
METRIC RATING
306th/ 347
METRIC RANK
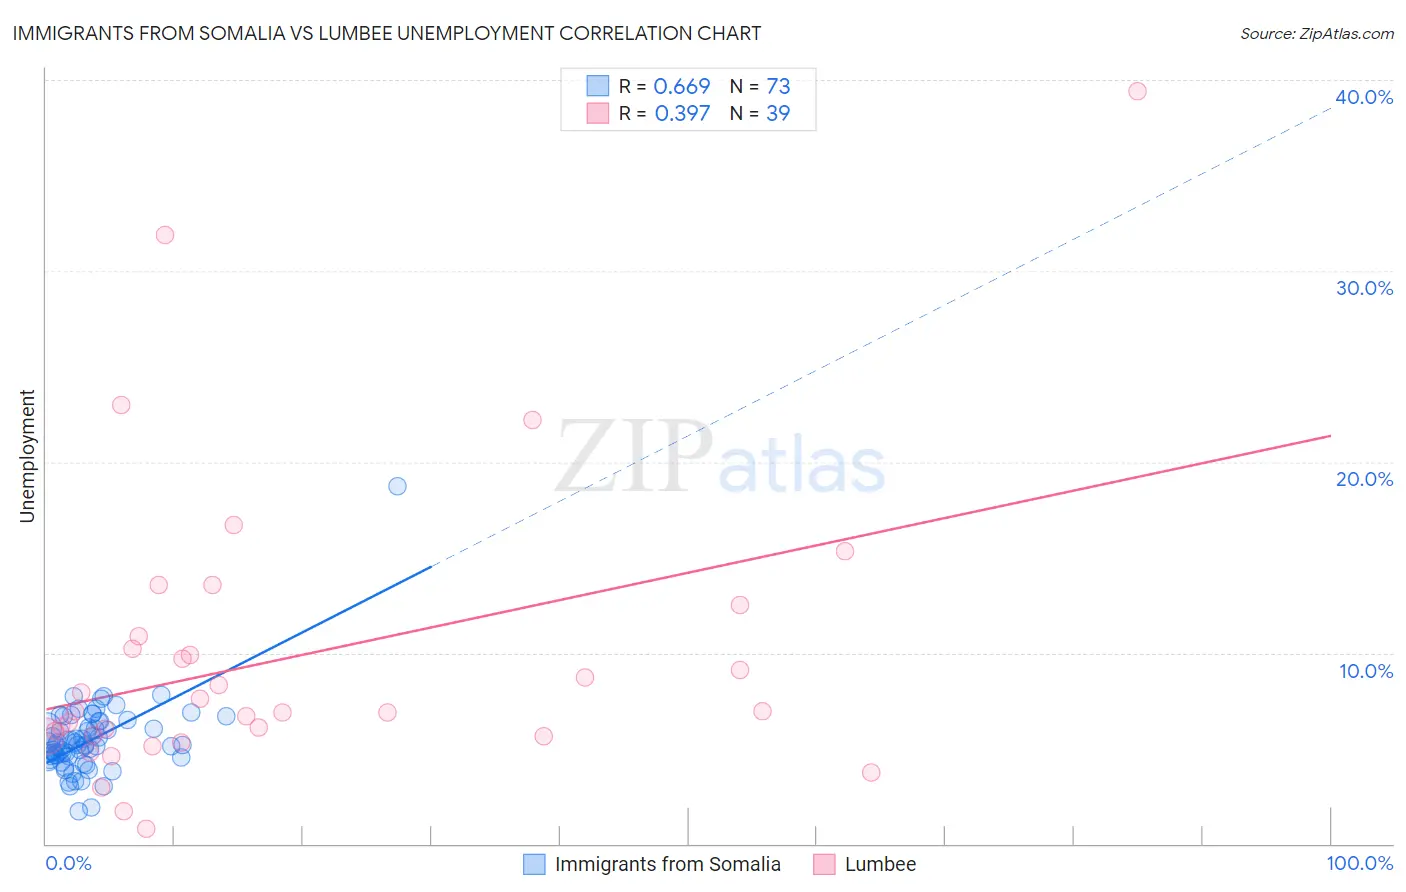
Immigrants from Somalia vs Lumbee Unemployment Correlation Chart
The statistical analysis conducted on geographies consisting of 92,091,323 people shows a significant positive correlation between the proportion of Immigrants from Somalia and unemployment in the United States with a correlation coefficient (R) of 0.669 and weighted average of 5.3%. Similarly, the statistical analysis conducted on geographies consisting of 92,248,032 people shows a mild positive correlation between the proportion of Lumbee and unemployment in the United States with a correlation coefficient (R) of 0.397 and weighted average of 6.4%, a difference of 21.2%.
Unemployment Correlation Summary
| Measurement | Immigrants from Somalia | Lumbee |
| Minimum | 1.7% | 0.80% |
| Maximum | 18.7% | 39.4% |
| Range | 17.0% | 38.6% |
| Mean | 5.4% | 9.8% |
| Median | 5.2% | 6.9% |
| Interquartile 25% (IQ1) | 4.5% | 5.6% |
| Interquartile 75% (IQ3) | 6.2% | 10.9% |
| Interquartile Range (IQR) | 1.7% | 5.2% |
| Standard Deviation (Sample) | 2.1% | 7.8% |
| Standard Deviation (Population) | 2.0% | 7.7% |
Similar Demographics by Unemployment
Demographics Similar to Immigrants from Somalia by Unemployment
In terms of unemployment, the demographic groups most similar to Immigrants from Somalia are Somali (5.3%, a difference of 0.010%), South American (5.3%, a difference of 0.010%), Arab (5.3%, a difference of 0.10%), Immigrants from Belarus (5.3%, a difference of 0.12%), and Immigrants from Laos (5.3%, a difference of 0.20%).
| Demographics | Rating | Rank | Unemployment |
| Immigrants | Uganda | 37.8 /100 | #186 | Fair 5.3% |
| Costa Ricans | 37.4 /100 | #187 | Fair 5.3% |
| Alsatians | 37.0 /100 | #188 | Fair 5.3% |
| Immigrants | Belarus | 35.6 /100 | #189 | Fair 5.3% |
| Arabs | 35.3 /100 | #190 | Fair 5.3% |
| Somalis | 34.0 /100 | #191 | Fair 5.3% |
| South Americans | 33.9 /100 | #192 | Fair 5.3% |
| Immigrants | Somalia | 33.8 /100 | #193 | Fair 5.3% |
| Immigrants | Laos | 30.9 /100 | #194 | Fair 5.3% |
| Immigrants | Southern Europe | 30.9 /100 | #195 | Fair 5.3% |
| Peruvians | 29.9 /100 | #196 | Fair 5.3% |
| Immigrants | Uruguay | 29.8 /100 | #197 | Fair 5.3% |
| Immigrants | Israel | 28.6 /100 | #198 | Fair 5.3% |
| Immigrants | Afghanistan | 28.6 /100 | #199 | Fair 5.3% |
| Koreans | 27.4 /100 | #200 | Fair 5.3% |
Demographics Similar to Lumbee by Unemployment
In terms of unemployment, the demographic groups most similar to Lumbee are Menominee (6.4%, a difference of 0.030%), Immigrants from Jamaica (6.4%, a difference of 0.29%), Immigrants from Bangladesh (6.5%, a difference of 0.48%), Barbadian (6.5%, a difference of 0.86%), and Vietnamese (6.5%, a difference of 0.87%).
| Demographics | Rating | Rank | Unemployment |
| Immigrants | West Indies | 0.0 /100 | #299 | Tragic 6.3% |
| Immigrants | Trinidad and Tobago | 0.0 /100 | #300 | Tragic 6.3% |
| Trinidadians and Tobagonians | 0.0 /100 | #301 | Tragic 6.3% |
| West Indians | 0.0 /100 | #302 | Tragic 6.4% |
| Belizeans | 0.0 /100 | #303 | Tragic 6.4% |
| Immigrants | Jamaica | 0.0 /100 | #304 | Tragic 6.4% |
| Menominee | 0.0 /100 | #305 | Tragic 6.4% |
| Lumbee | 0.0 /100 | #306 | Tragic 6.4% |
| Immigrants | Bangladesh | 0.0 /100 | #307 | Tragic 6.5% |
| Barbadians | 0.0 /100 | #308 | Tragic 6.5% |
| Vietnamese | 0.0 /100 | #309 | Tragic 6.5% |
| Immigrants | Belize | 0.0 /100 | #310 | Tragic 6.5% |
| Cape Verdeans | 0.0 /100 | #311 | Tragic 6.5% |
| Colville | 0.0 /100 | #312 | Tragic 6.6% |
| Immigrants | Barbados | 0.0 /100 | #313 | Tragic 6.6% |