Slovene vs Immigrants from Bangladesh Male Unemployment
COMPARE
Slovene
Immigrants from Bangladesh
Male Unemployment
Male Unemployment Comparison
Slovenes
Immigrants from Bangladesh
5.0%
MALE UNEMPLOYMENT
98.8/ 100
METRIC RATING
51st/ 347
METRIC RANK
6.6%
MALE UNEMPLOYMENT
0.0/ 100
METRIC RATING
299th/ 347
METRIC RANK
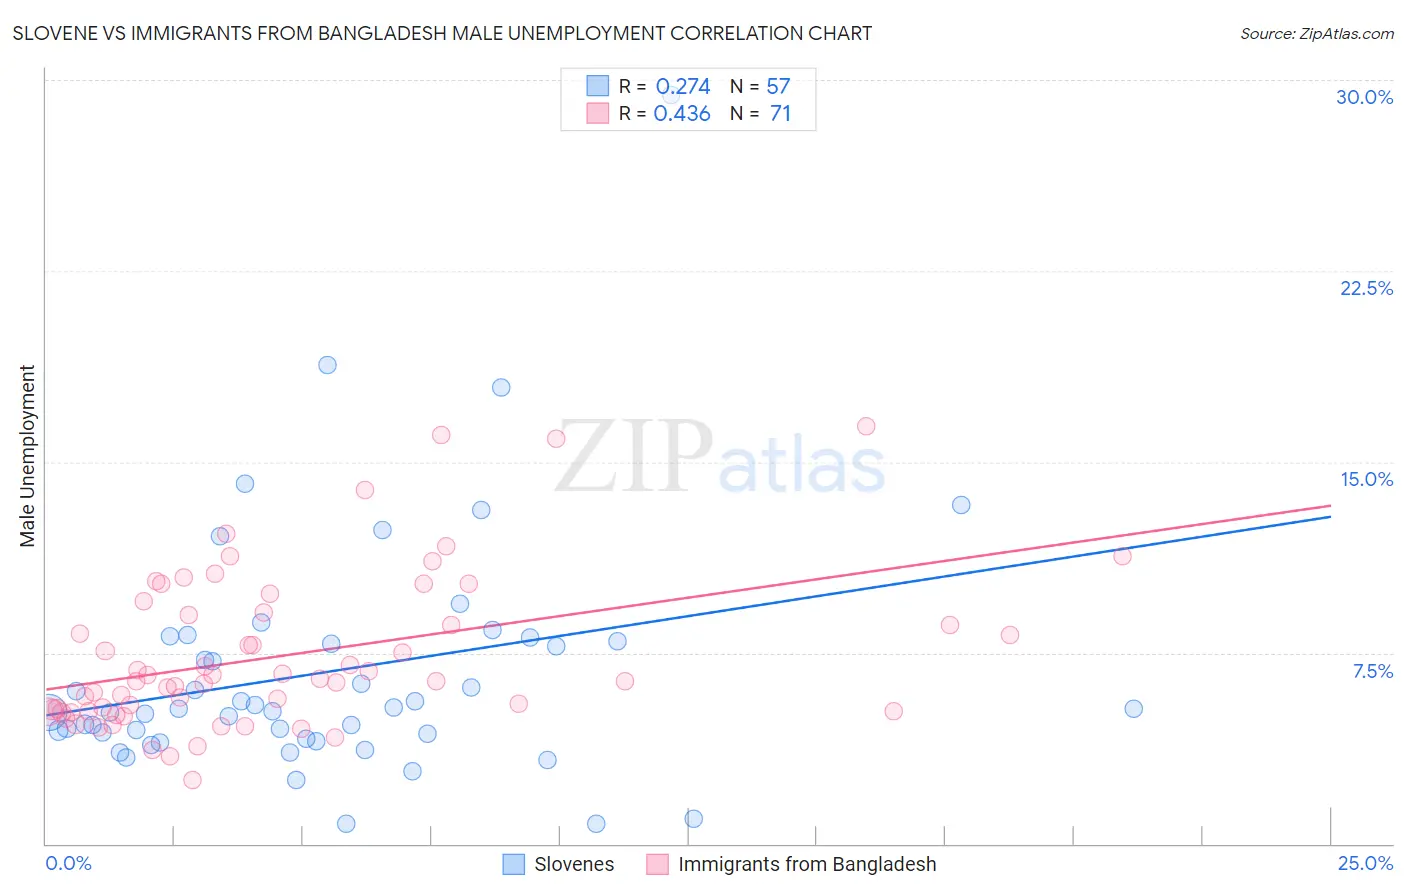
Slovene vs Immigrants from Bangladesh Male Unemployment Correlation Chart
The statistical analysis conducted on geographies consisting of 260,529,032 people shows a weak positive correlation between the proportion of Slovenes and unemployment rate among males in the United States with a correlation coefficient (R) of 0.274 and weighted average of 5.0%. Similarly, the statistical analysis conducted on geographies consisting of 203,494,177 people shows a moderate positive correlation between the proportion of Immigrants from Bangladesh and unemployment rate among males in the United States with a correlation coefficient (R) of 0.436 and weighted average of 6.6%, a difference of 32.6%.
Male Unemployment Correlation Summary
| Measurement | Slovene | Immigrants from Bangladesh |
| Minimum | 0.80% | 2.5% |
| Maximum | 29.4% | 16.4% |
| Range | 28.6% | 13.9% |
| Mean | 6.8% | 7.4% |
| Median | 5.3% | 6.4% |
| Interquartile 25% (IQ1) | 4.2% | 5.2% |
| Interquartile 75% (IQ3) | 8.0% | 9.1% |
| Interquartile Range (IQR) | 3.8% | 3.9% |
| Standard Deviation (Sample) | 4.8% | 3.0% |
| Standard Deviation (Population) | 4.8% | 3.0% |
Similar Demographics by Male Unemployment
Demographics Similar to Slovenes by Male Unemployment
In terms of male unemployment, the demographic groups most similar to Slovenes are Irish (5.0%, a difference of 0.020%), Polish (4.9%, a difference of 0.040%), Croatian (4.9%, a difference of 0.040%), Immigrants from Scotland (4.9%, a difference of 0.060%), and Austrian (4.9%, a difference of 0.070%).
| Demographics | Rating | Rank | Male Unemployment |
| Immigrants | Korea | 99.1 /100 | #44 | Exceptional 4.9% |
| Immigrants | Zimbabwe | 99.0 /100 | #45 | Exceptional 4.9% |
| Bhutanese | 98.9 /100 | #46 | Exceptional 4.9% |
| Austrians | 98.9 /100 | #47 | Exceptional 4.9% |
| Immigrants | Scotland | 98.9 /100 | #48 | Exceptional 4.9% |
| Poles | 98.9 /100 | #49 | Exceptional 4.9% |
| Croatians | 98.9 /100 | #50 | Exceptional 4.9% |
| Slovenes | 98.8 /100 | #51 | Exceptional 5.0% |
| Irish | 98.8 /100 | #52 | Exceptional 5.0% |
| Jordanians | 98.8 /100 | #53 | Exceptional 5.0% |
| Yugoslavians | 98.7 /100 | #54 | Exceptional 5.0% |
| Czechoslovakians | 98.7 /100 | #55 | Exceptional 5.0% |
| Immigrants | Bulgaria | 98.7 /100 | #56 | Exceptional 5.0% |
| Turks | 98.5 /100 | #57 | Exceptional 5.0% |
| Lithuanians | 98.5 /100 | #58 | Exceptional 5.0% |
Demographics Similar to Immigrants from Bangladesh by Male Unemployment
In terms of male unemployment, the demographic groups most similar to Immigrants from Bangladesh are Jamaican (6.6%, a difference of 0.13%), Chippewa (6.6%, a difference of 0.21%), Vietnamese (6.6%, a difference of 0.27%), Immigrants from Belize (6.6%, a difference of 0.38%), and Immigrants from Haiti (6.5%, a difference of 0.53%).
| Demographics | Rating | Rank | Male Unemployment |
| Nepalese | 0.0 /100 | #292 | Tragic 6.4% |
| Haitians | 0.0 /100 | #293 | Tragic 6.4% |
| Senegalese | 0.0 /100 | #294 | Tragic 6.4% |
| Belizeans | 0.0 /100 | #295 | Tragic 6.5% |
| Immigrants | Haiti | 0.0 /100 | #296 | Tragic 6.5% |
| Chippewa | 0.0 /100 | #297 | Tragic 6.6% |
| Jamaicans | 0.0 /100 | #298 | Tragic 6.6% |
| Immigrants | Bangladesh | 0.0 /100 | #299 | Tragic 6.6% |
| Vietnamese | 0.0 /100 | #300 | Tragic 6.6% |
| Immigrants | Belize | 0.0 /100 | #301 | Tragic 6.6% |
| Ute | 0.0 /100 | #302 | Tragic 6.6% |
| Immigrants | West Indies | 0.0 /100 | #303 | Tragic 6.7% |
| West Indians | 0.0 /100 | #304 | Tragic 6.7% |
| Trinidadians and Tobagonians | 0.0 /100 | #305 | Tragic 6.7% |
| Immigrants | Trinidad and Tobago | 0.0 /100 | #306 | Tragic 6.7% |