Mongolian vs Immigrants from South Central Asia Female Unemployment
COMPARE
Mongolian
Immigrants from South Central Asia
Female Unemployment
Female Unemployment Comparison
Mongolians
Immigrants from South Central Asia
5.0%
FEMALE UNEMPLOYMENT
97.8/ 100
METRIC RATING
77th/ 347
METRIC RANK
5.0%
FEMALE UNEMPLOYMENT
95.5/ 100
METRIC RATING
96th/ 347
METRIC RANK
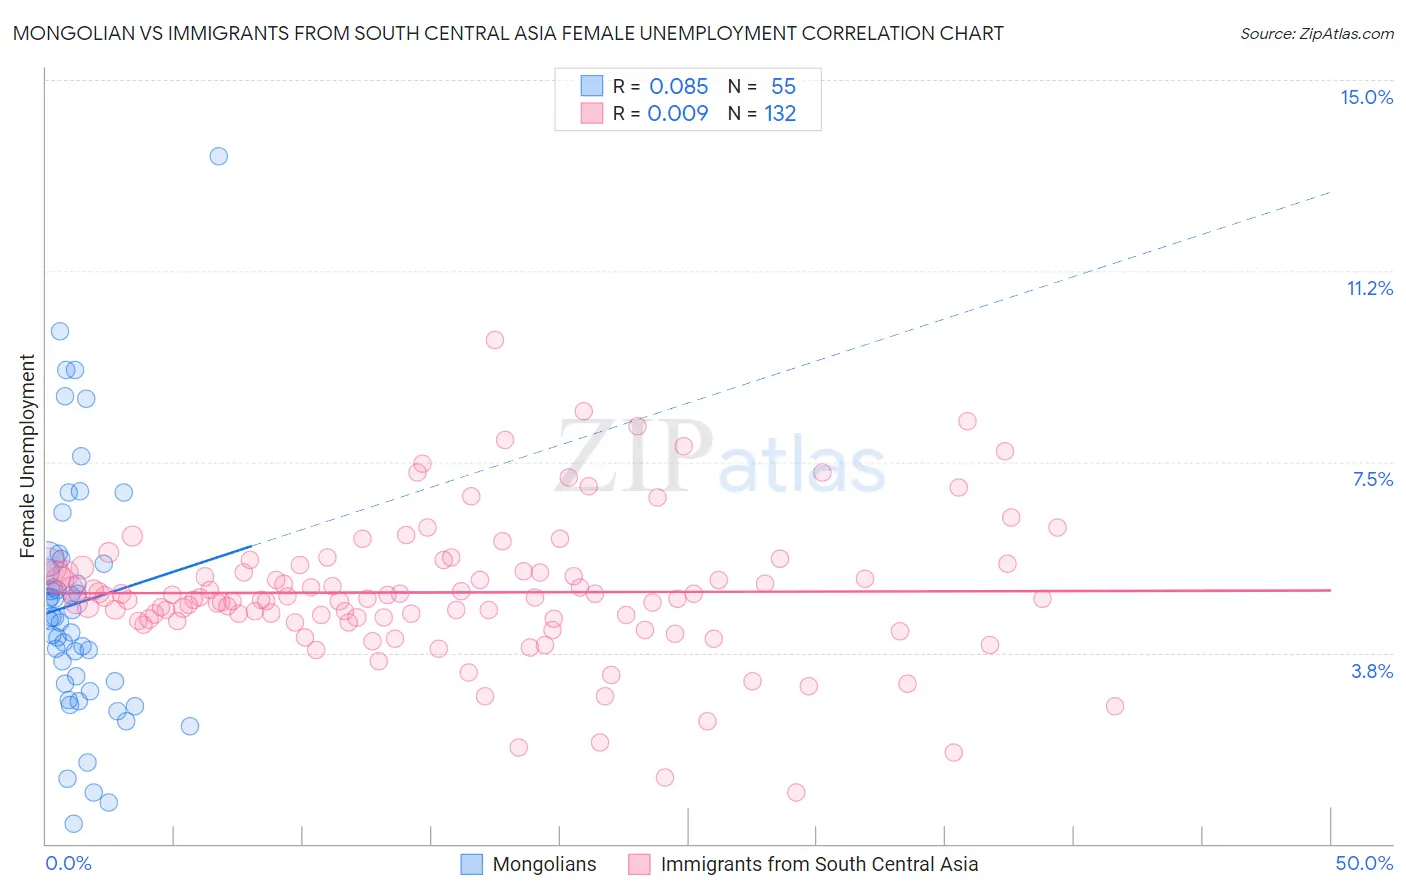
Mongolian vs Immigrants from South Central Asia Female Unemployment Correlation Chart
The statistical analysis conducted on geographies consisting of 140,252,025 people shows a slight positive correlation between the proportion of Mongolians and unemploymnet rate among females in the United States with a correlation coefficient (R) of 0.085 and weighted average of 5.0%. Similarly, the statistical analysis conducted on geographies consisting of 470,050,410 people shows no correlation between the proportion of Immigrants from South Central Asia and unemploymnet rate among females in the United States with a correlation coefficient (R) of 0.009 and weighted average of 5.0%, a difference of 1.2%.
Female Unemployment Correlation Summary
| Measurement | Mongolian | Immigrants from South Central Asia |
| Minimum | 0.40% | 1.0% |
| Maximum | 13.5% | 9.9% |
| Range | 13.1% | 8.9% |
| Mean | 4.7% | 4.9% |
| Median | 4.4% | 4.8% |
| Interquartile 25% (IQ1) | 3.1% | 4.4% |
| Interquartile 75% (IQ3) | 5.6% | 5.4% |
| Interquartile Range (IQR) | 2.5% | 1.0% |
| Standard Deviation (Sample) | 2.5% | 1.4% |
| Standard Deviation (Population) | 2.4% | 1.4% |
Demographics Similar to Mongolians and Immigrants from South Central Asia by Female Unemployment
In terms of female unemployment, the demographic groups most similar to Mongolians are Immigrants from Netherlands (5.0%, a difference of 0.0%), Immigrants from Venezuela (5.0%, a difference of 0.090%), Turkish (5.0%, a difference of 0.19%), New Zealander (5.0%, a difference of 0.30%), and Filipino (5.0%, a difference of 0.33%). Similarly, the demographic groups most similar to Immigrants from South Central Asia are Burmese (5.0%, a difference of 0.040%), Immigrants from Malaysia (5.0%, a difference of 0.060%), Immigrants from Austria (5.0%, a difference of 0.090%), Romanian (5.0%, a difference of 0.16%), and Immigrants from Japan (5.0%, a difference of 0.19%).
| Demographics | Rating | Rank | Female Unemployment |
| Immigrants | Venezuela | 97.9 /100 | #76 | Exceptional 5.0% |
| Mongolians | 97.8 /100 | #77 | Exceptional 5.0% |
| Immigrants | Netherlands | 97.8 /100 | #78 | Exceptional 5.0% |
| Turks | 97.6 /100 | #79 | Exceptional 5.0% |
| New Zealanders | 97.4 /100 | #80 | Exceptional 5.0% |
| Filipinos | 97.3 /100 | #81 | Exceptional 5.0% |
| Immigrants | Australia | 97.3 /100 | #82 | Exceptional 5.0% |
| Immigrants | Serbia | 97.2 /100 | #83 | Exceptional 5.0% |
| Canadians | 97.2 /100 | #84 | Exceptional 5.0% |
| Ukrainians | 97.1 /100 | #85 | Exceptional 5.0% |
| Bolivians | 97.1 /100 | #86 | Exceptional 5.0% |
| Venezuelans | 96.9 /100 | #87 | Exceptional 5.0% |
| Immigrants | Sudan | 96.7 /100 | #88 | Exceptional 5.0% |
| Immigrants | Taiwan | 96.6 /100 | #89 | Exceptional 5.0% |
| Immigrants | Sweden | 96.3 /100 | #90 | Exceptional 5.0% |
| Immigrants | Japan | 96.0 /100 | #91 | Exceptional 5.0% |
| Romanians | 95.9 /100 | #92 | Exceptional 5.0% |
| Immigrants | Austria | 95.7 /100 | #93 | Exceptional 5.0% |
| Immigrants | Malaysia | 95.7 /100 | #94 | Exceptional 5.0% |
| Burmese | 95.6 /100 | #95 | Exceptional 5.0% |
| Immigrants | South Central Asia | 95.5 /100 | #96 | Exceptional 5.0% |