Mexican vs Immigrants from Hungary Unemployment Among Women with Children Ages 6 to 17 years
COMPARE
Mexican
Immigrants from Hungary
Unemployment Among Women with Children Ages 6 to 17 years
Unemployment Among Women with Children Ages 6 to 17 years Comparison
Mexicans
Immigrants from Hungary
9.3%
UNEMPLOYMENT AMONG WOMEN WITH CHILDREN AGES 6 TO 17 YEARS
3.2/ 100
METRIC RATING
234th/ 347
METRIC RANK
8.9%
UNEMPLOYMENT AMONG WOMEN WITH CHILDREN AGES 6 TO 17 YEARS
63.4/ 100
METRIC RATING
160th/ 347
METRIC RANK
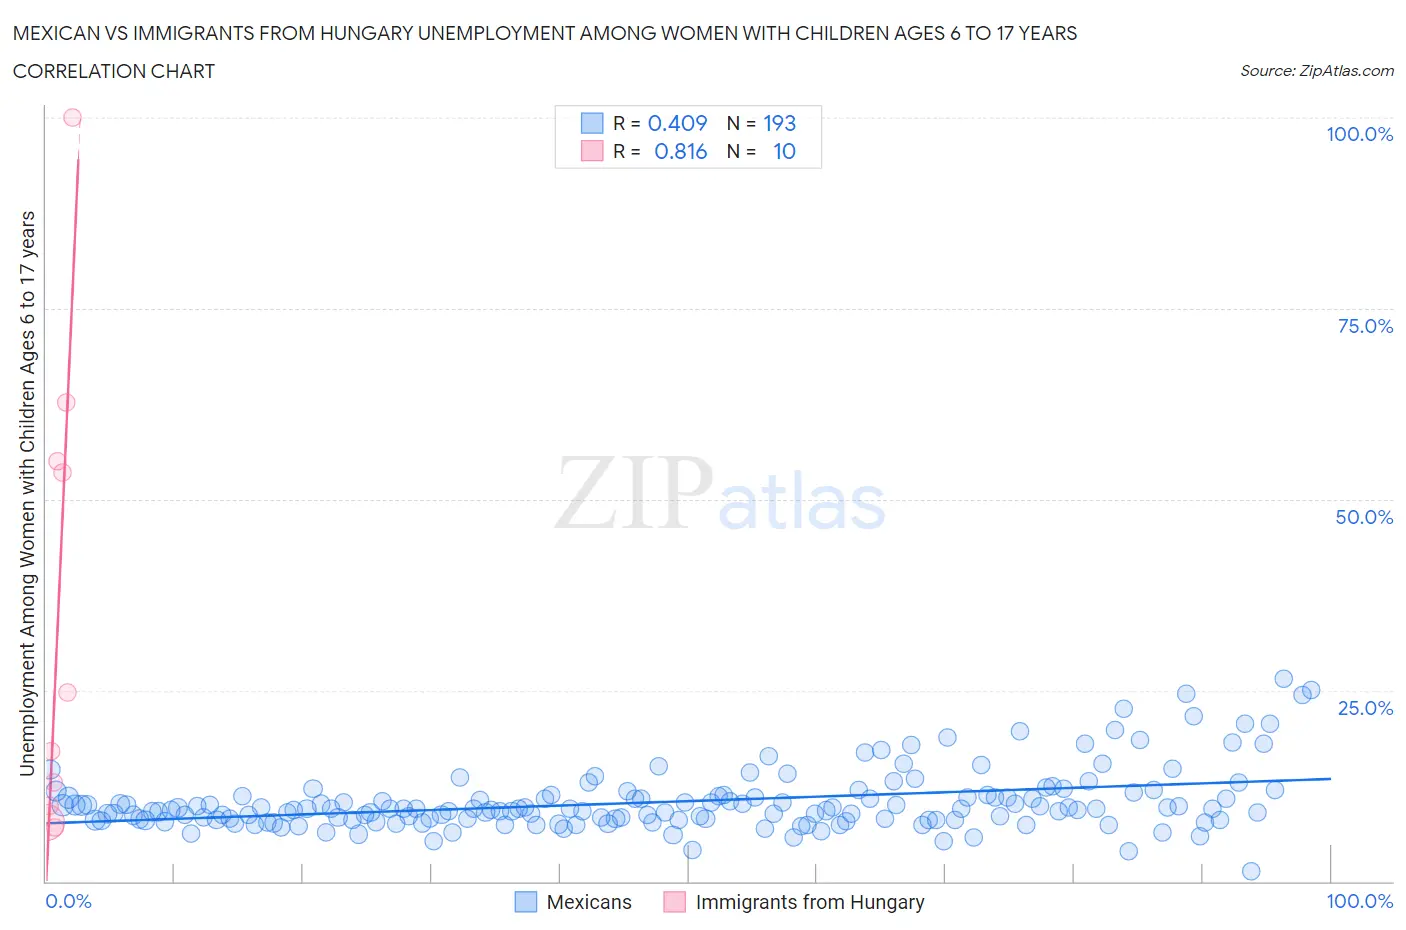
Mexican vs Immigrants from Hungary Unemployment Among Women with Children Ages 6 to 17 years Correlation Chart
The statistical analysis conducted on geographies consisting of 358,737,639 people shows a moderate positive correlation between the proportion of Mexicans and unemployment rate among women with children between the ages 6 and 17 in the United States with a correlation coefficient (R) of 0.409 and weighted average of 9.3%. Similarly, the statistical analysis conducted on geographies consisting of 155,870,512 people shows a very strong positive correlation between the proportion of Immigrants from Hungary and unemployment rate among women with children between the ages 6 and 17 in the United States with a correlation coefficient (R) of 0.816 and weighted average of 8.9%, a difference of 4.4%.
Unemployment Among Women with Children Ages 6 to 17 years Correlation Summary
| Measurement | Mexican | Immigrants from Hungary |
| Minimum | 1.4% | 7.0% |
| Maximum | 26.5% | 100.0% |
| Range | 25.1% | 93.0% |
| Mean | 10.4% | 35.0% |
| Median | 9.4% | 20.8% |
| Interquartile 25% (IQ1) | 8.1% | 9.9% |
| Interquartile 75% (IQ3) | 11.2% | 55.0% |
| Interquartile Range (IQR) | 3.1% | 45.1% |
| Standard Deviation (Sample) | 4.0% | 31.3% |
| Standard Deviation (Population) | 4.0% | 29.7% |
Similar Demographics by Unemployment Among Women with Children Ages 6 to 17 years
Demographics Similar to Mexicans by Unemployment Among Women with Children Ages 6 to 17 years
In terms of unemployment among women with children ages 6 to 17 years, the demographic groups most similar to Mexicans are Immigrants from St. Vincent and the Grenadines (9.3%, a difference of 0.030%), Uruguayan (9.3%, a difference of 0.070%), Hungarian (9.3%, a difference of 0.090%), Immigrants from Belize (9.3%, a difference of 0.14%), and French American Indian (9.3%, a difference of 0.15%).
| Demographics | Rating | Rank | Unemployment Among Women with Children Ages 6 to 17 years |
| Panamanians | 4.5 /100 | #227 | Tragic 9.3% |
| Estonians | 4.4 /100 | #228 | Tragic 9.3% |
| Lumbee | 4.3 /100 | #229 | Tragic 9.3% |
| Welsh | 4.0 /100 | #230 | Tragic 9.3% |
| Macedonians | 3.9 /100 | #231 | Tragic 9.3% |
| French American Indians | 3.7 /100 | #232 | Tragic 9.3% |
| Immigrants | St. Vincent and the Grenadines | 3.3 /100 | #233 | Tragic 9.3% |
| Mexicans | 3.2 /100 | #234 | Tragic 9.3% |
| Uruguayans | 3.0 /100 | #235 | Tragic 9.3% |
| Hungarians | 3.0 /100 | #236 | Tragic 9.3% |
| Immigrants | Belize | 2.8 /100 | #237 | Tragic 9.3% |
| Arabs | 2.7 /100 | #238 | Tragic 9.3% |
| Immigrants | Saudi Arabia | 2.7 /100 | #239 | Tragic 9.3% |
| Guatemalans | 2.3 /100 | #240 | Tragic 9.3% |
| Colombians | 2.2 /100 | #241 | Tragic 9.3% |
Demographics Similar to Immigrants from Hungary by Unemployment Among Women with Children Ages 6 to 17 years
In terms of unemployment among women with children ages 6 to 17 years, the demographic groups most similar to Immigrants from Hungary are Spanish (8.9%, a difference of 0.020%), Immigrants from Guyana (8.9%, a difference of 0.020%), Immigrants from Chile (8.9%, a difference of 0.090%), Immigrants from Belgium (8.9%, a difference of 0.11%), and Osage (8.9%, a difference of 0.12%).
| Demographics | Rating | Rank | Unemployment Among Women with Children Ages 6 to 17 years |
| Immigrants | Europe | 73.4 /100 | #153 | Good 8.9% |
| Vietnamese | 72.1 /100 | #154 | Good 8.9% |
| Immigrants | Greece | 71.8 /100 | #155 | Good 8.9% |
| Osage | 65.9 /100 | #156 | Good 8.9% |
| Immigrants | Belgium | 65.6 /100 | #157 | Good 8.9% |
| Immigrants | Chile | 65.3 /100 | #158 | Good 8.9% |
| Spanish | 63.8 /100 | #159 | Good 8.9% |
| Immigrants | Hungary | 63.4 /100 | #160 | Good 8.9% |
| Immigrants | Guyana | 63.0 /100 | #161 | Good 8.9% |
| Immigrants | Netherlands | 60.8 /100 | #162 | Good 8.9% |
| Mexican American Indians | 60.6 /100 | #163 | Good 8.9% |
| Ukrainians | 59.7 /100 | #164 | Average 8.9% |
| Immigrants | Micronesia | 59.2 /100 | #165 | Average 8.9% |
| Moroccans | 58.3 /100 | #166 | Average 8.9% |
| Immigrants | England | 57.7 /100 | #167 | Average 8.9% |