Mexican vs Guyanese Unemployment Among Women with Children Ages 6 to 17 years
COMPARE
Mexican
Guyanese
Unemployment Among Women with Children Ages 6 to 17 years
Unemployment Among Women with Children Ages 6 to 17 years Comparison
Mexicans
Guyanese
9.3%
UNEMPLOYMENT AMONG WOMEN WITH CHILDREN AGES 6 TO 17 YEARS
3.2/ 100
METRIC RATING
234th/ 347
METRIC RANK
9.1%
UNEMPLOYMENT AMONG WOMEN WITH CHILDREN AGES 6 TO 17 YEARS
21.8/ 100
METRIC RATING
198th/ 347
METRIC RANK
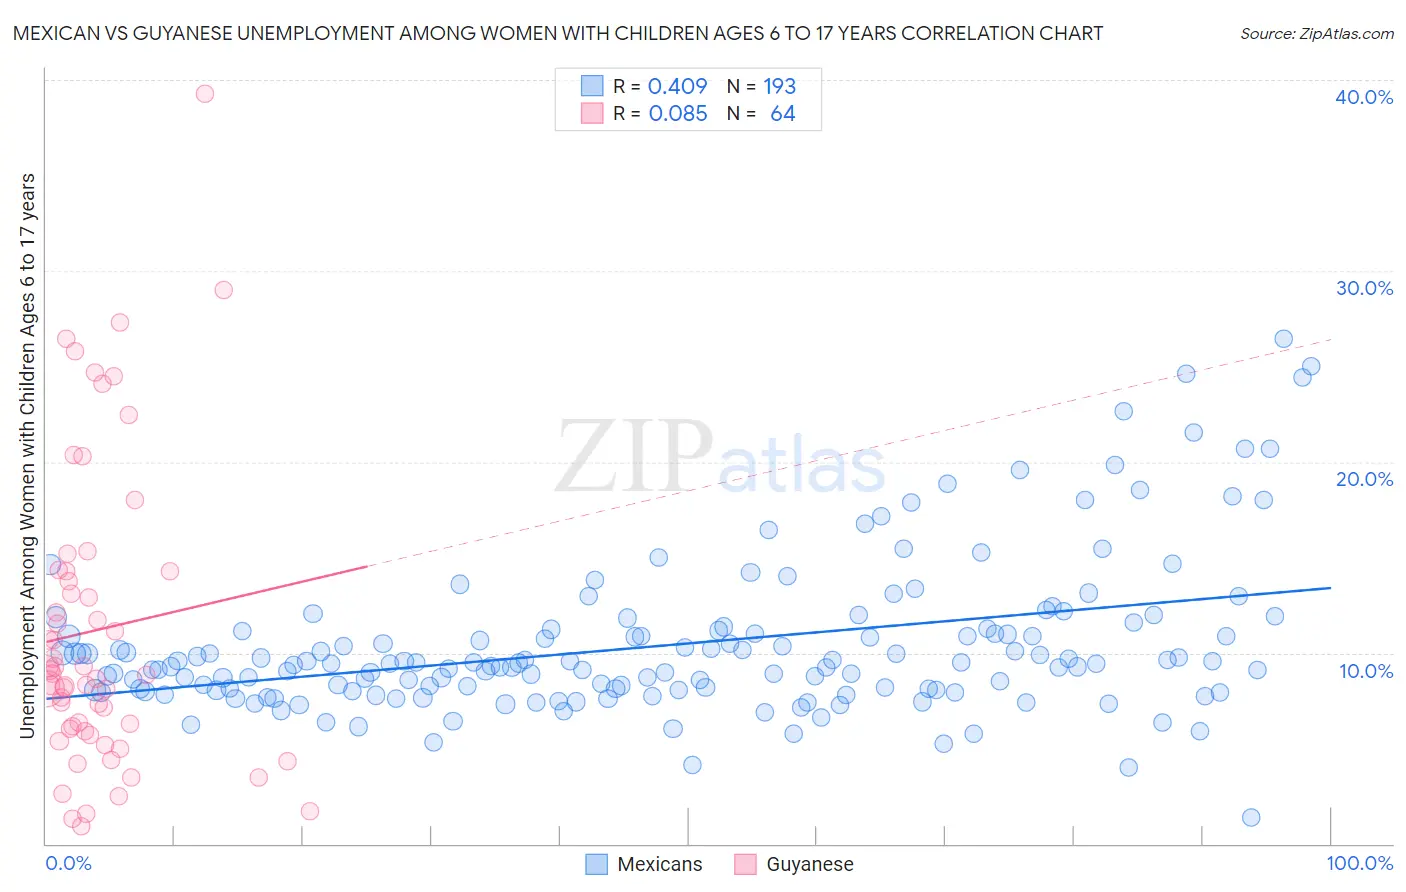
Mexican vs Guyanese Unemployment Among Women with Children Ages 6 to 17 years Correlation Chart
The statistical analysis conducted on geographies consisting of 358,737,639 people shows a moderate positive correlation between the proportion of Mexicans and unemployment rate among women with children between the ages 6 and 17 in the United States with a correlation coefficient (R) of 0.409 and weighted average of 9.3%. Similarly, the statistical analysis conducted on geographies consisting of 145,239,239 people shows a slight positive correlation between the proportion of Guyanese and unemployment rate among women with children between the ages 6 and 17 in the United States with a correlation coefficient (R) of 0.085 and weighted average of 9.1%, a difference of 2.3%.
Unemployment Among Women with Children Ages 6 to 17 years Correlation Summary
| Measurement | Mexican | Guyanese |
| Minimum | 1.4% | 0.90% |
| Maximum | 26.5% | 39.3% |
| Range | 25.1% | 38.4% |
| Mean | 10.4% | 11.2% |
| Median | 9.4% | 8.9% |
| Interquartile 25% (IQ1) | 8.1% | 5.9% |
| Interquartile 75% (IQ3) | 11.2% | 14.3% |
| Interquartile Range (IQR) | 3.1% | 8.4% |
| Standard Deviation (Sample) | 4.0% | 7.9% |
| Standard Deviation (Population) | 4.0% | 7.9% |
Similar Demographics by Unemployment Among Women with Children Ages 6 to 17 years
Demographics Similar to Mexicans by Unemployment Among Women with Children Ages 6 to 17 years
In terms of unemployment among women with children ages 6 to 17 years, the demographic groups most similar to Mexicans are Immigrants from St. Vincent and the Grenadines (9.3%, a difference of 0.030%), Uruguayan (9.3%, a difference of 0.070%), Hungarian (9.3%, a difference of 0.090%), Immigrants from Belize (9.3%, a difference of 0.14%), and French American Indian (9.3%, a difference of 0.15%).
| Demographics | Rating | Rank | Unemployment Among Women with Children Ages 6 to 17 years |
| Panamanians | 4.5 /100 | #227 | Tragic 9.3% |
| Estonians | 4.4 /100 | #228 | Tragic 9.3% |
| Lumbee | 4.3 /100 | #229 | Tragic 9.3% |
| Welsh | 4.0 /100 | #230 | Tragic 9.3% |
| Macedonians | 3.9 /100 | #231 | Tragic 9.3% |
| French American Indians | 3.7 /100 | #232 | Tragic 9.3% |
| Immigrants | St. Vincent and the Grenadines | 3.3 /100 | #233 | Tragic 9.3% |
| Mexicans | 3.2 /100 | #234 | Tragic 9.3% |
| Uruguayans | 3.0 /100 | #235 | Tragic 9.3% |
| Hungarians | 3.0 /100 | #236 | Tragic 9.3% |
| Immigrants | Belize | 2.8 /100 | #237 | Tragic 9.3% |
| Arabs | 2.7 /100 | #238 | Tragic 9.3% |
| Immigrants | Saudi Arabia | 2.7 /100 | #239 | Tragic 9.3% |
| Guatemalans | 2.3 /100 | #240 | Tragic 9.3% |
| Colombians | 2.2 /100 | #241 | Tragic 9.3% |
Demographics Similar to Guyanese by Unemployment Among Women with Children Ages 6 to 17 years
In terms of unemployment among women with children ages 6 to 17 years, the demographic groups most similar to Guyanese are Czechoslovakian (9.1%, a difference of 0.070%), Immigrants from Panama (9.1%, a difference of 0.15%), Brazilian (9.1%, a difference of 0.16%), Austrian (9.1%, a difference of 0.19%), and Immigrants from Kazakhstan (9.1%, a difference of 0.21%).
| Demographics | Rating | Rank | Unemployment Among Women with Children Ages 6 to 17 years |
| Belizeans | 28.4 /100 | #191 | Fair 9.1% |
| Guamanians/Chamorros | 27.2 /100 | #192 | Fair 9.1% |
| Immigrants | Turkey | 25.8 /100 | #193 | Fair 9.1% |
| Immigrants | Kazakhstan | 25.3 /100 | #194 | Fair 9.1% |
| Austrians | 25.0 /100 | #195 | Fair 9.1% |
| Brazilians | 24.4 /100 | #196 | Fair 9.1% |
| Immigrants | Panama | 24.3 /100 | #197 | Fair 9.1% |
| Guyanese | 21.8 /100 | #198 | Fair 9.1% |
| Czechoslovakians | 20.8 /100 | #199 | Fair 9.1% |
| Trinidadians and Tobagonians | 18.2 /100 | #200 | Poor 9.1% |
| Immigrants | Trinidad and Tobago | 16.7 /100 | #201 | Poor 9.1% |
| Immigrants | Middle Africa | 15.6 /100 | #202 | Poor 9.1% |
| Maltese | 15.3 /100 | #203 | Poor 9.1% |
| Immigrants | Canada | 15.3 /100 | #204 | Poor 9.1% |
| Immigrants | Western Europe | 14.1 /100 | #205 | Poor 9.1% |