Mexican vs Immigrants from Hong Kong Unemployment Among Women with Children Ages 6 to 17 years
COMPARE
Mexican
Immigrants from Hong Kong
Unemployment Among Women with Children Ages 6 to 17 years
Unemployment Among Women with Children Ages 6 to 17 years Comparison
Mexicans
Immigrants from Hong Kong
9.3%
UNEMPLOYMENT AMONG WOMEN WITH CHILDREN AGES 6 TO 17 YEARS
3.2/ 100
METRIC RATING
234th/ 347
METRIC RANK
7.2%
UNEMPLOYMENT AMONG WOMEN WITH CHILDREN AGES 6 TO 17 YEARS
100.0/ 100
METRIC RATING
8th/ 347
METRIC RANK
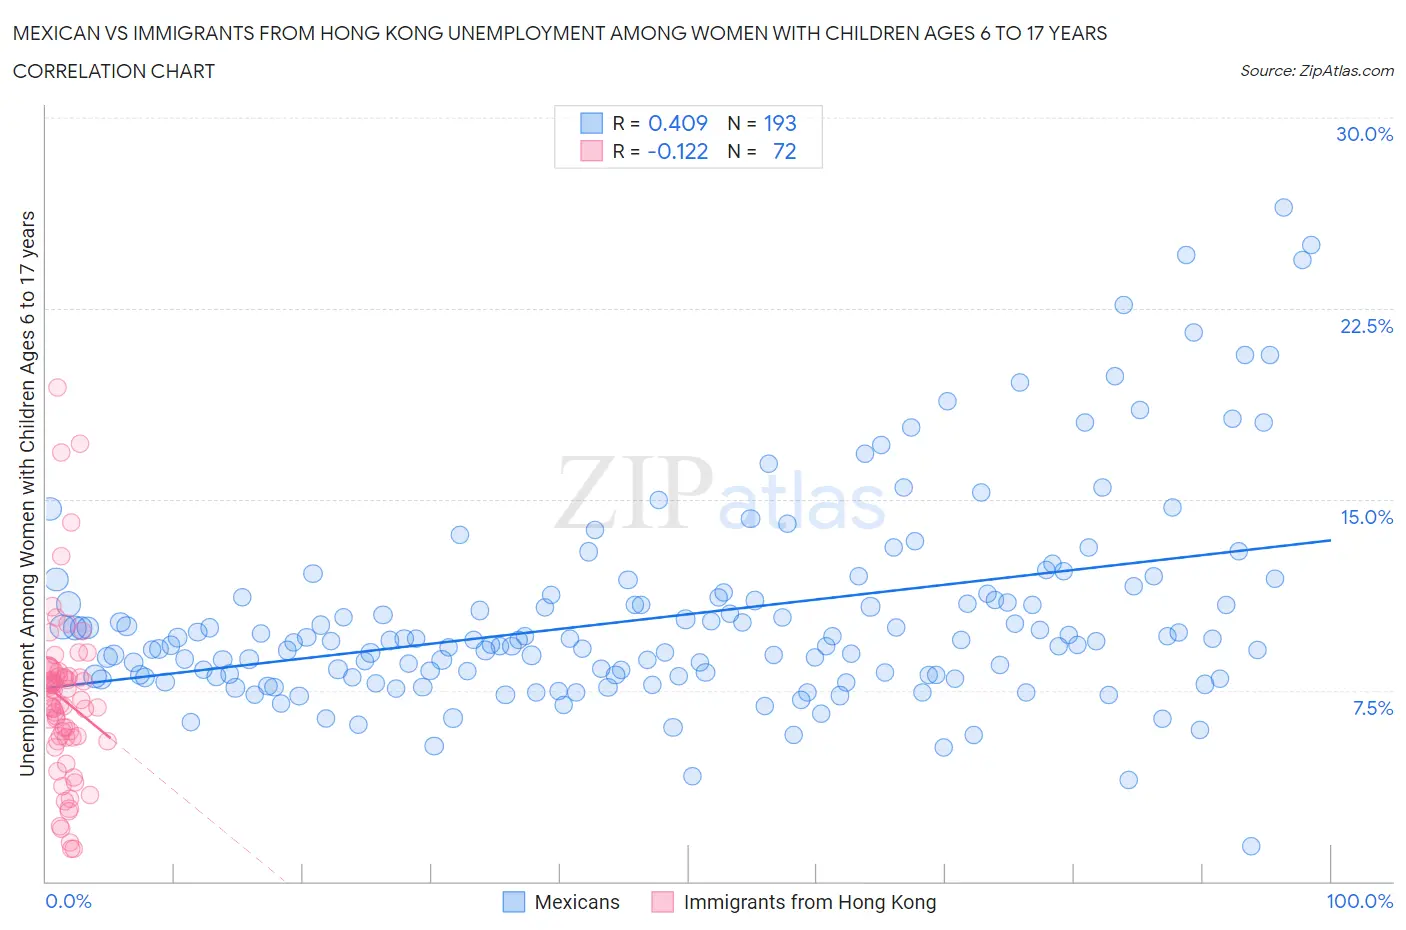
Mexican vs Immigrants from Hong Kong Unemployment Among Women with Children Ages 6 to 17 years Correlation Chart
The statistical analysis conducted on geographies consisting of 358,737,639 people shows a moderate positive correlation between the proportion of Mexicans and unemployment rate among women with children between the ages 6 and 17 in the United States with a correlation coefficient (R) of 0.409 and weighted average of 9.3%. Similarly, the statistical analysis conducted on geographies consisting of 197,270,459 people shows a poor negative correlation between the proportion of Immigrants from Hong Kong and unemployment rate among women with children between the ages 6 and 17 in the United States with a correlation coefficient (R) of -0.122 and weighted average of 7.2%, a difference of 29.5%.
Unemployment Among Women with Children Ages 6 to 17 years Correlation Summary
| Measurement | Mexican | Immigrants from Hong Kong |
| Minimum | 1.4% | 1.3% |
| Maximum | 26.5% | 19.4% |
| Range | 25.1% | 18.1% |
| Mean | 10.4% | 7.1% |
| Median | 9.4% | 6.9% |
| Interquartile 25% (IQ1) | 8.1% | 5.6% |
| Interquartile 75% (IQ3) | 11.2% | 8.1% |
| Interquartile Range (IQR) | 3.1% | 2.5% |
| Standard Deviation (Sample) | 4.0% | 3.4% |
| Standard Deviation (Population) | 4.0% | 3.3% |
Similar Demographics by Unemployment Among Women with Children Ages 6 to 17 years
Demographics Similar to Mexicans by Unemployment Among Women with Children Ages 6 to 17 years
In terms of unemployment among women with children ages 6 to 17 years, the demographic groups most similar to Mexicans are Immigrants from St. Vincent and the Grenadines (9.3%, a difference of 0.030%), Uruguayan (9.3%, a difference of 0.070%), Hungarian (9.3%, a difference of 0.090%), Immigrants from Belize (9.3%, a difference of 0.14%), and French American Indian (9.3%, a difference of 0.15%).
| Demographics | Rating | Rank | Unemployment Among Women with Children Ages 6 to 17 years |
| Panamanians | 4.5 /100 | #227 | Tragic 9.3% |
| Estonians | 4.4 /100 | #228 | Tragic 9.3% |
| Lumbee | 4.3 /100 | #229 | Tragic 9.3% |
| Welsh | 4.0 /100 | #230 | Tragic 9.3% |
| Macedonians | 3.9 /100 | #231 | Tragic 9.3% |
| French American Indians | 3.7 /100 | #232 | Tragic 9.3% |
| Immigrants | St. Vincent and the Grenadines | 3.3 /100 | #233 | Tragic 9.3% |
| Mexicans | 3.2 /100 | #234 | Tragic 9.3% |
| Uruguayans | 3.0 /100 | #235 | Tragic 9.3% |
| Hungarians | 3.0 /100 | #236 | Tragic 9.3% |
| Immigrants | Belize | 2.8 /100 | #237 | Tragic 9.3% |
| Arabs | 2.7 /100 | #238 | Tragic 9.3% |
| Immigrants | Saudi Arabia | 2.7 /100 | #239 | Tragic 9.3% |
| Guatemalans | 2.3 /100 | #240 | Tragic 9.3% |
| Colombians | 2.2 /100 | #241 | Tragic 9.3% |
Demographics Similar to Immigrants from Hong Kong by Unemployment Among Women with Children Ages 6 to 17 years
In terms of unemployment among women with children ages 6 to 17 years, the demographic groups most similar to Immigrants from Hong Kong are Assyrian/Chaldean/Syriac (7.2%, a difference of 0.31%), Immigrants from Fiji (7.3%, a difference of 1.3%), Soviet Union (7.1%, a difference of 1.4%), Tlingit-Haida (7.1%, a difference of 1.5%), and Okinawan (7.0%, a difference of 2.0%).
| Demographics | Rating | Rank | Unemployment Among Women with Children Ages 6 to 17 years |
| Taiwanese | 100.0 /100 | #1 | Exceptional 6.5% |
| Fijians | 100.0 /100 | #2 | Exceptional 6.6% |
| Tongans | 100.0 /100 | #3 | Exceptional 6.7% |
| Ute | 100.0 /100 | #4 | Exceptional 7.0% |
| Okinawans | 100.0 /100 | #5 | Exceptional 7.0% |
| Tlingit-Haida | 100.0 /100 | #6 | Exceptional 7.1% |
| Soviet Union | 100.0 /100 | #7 | Exceptional 7.1% |
| Immigrants | Hong Kong | 100.0 /100 | #8 | Exceptional 7.2% |
| Assyrians/Chaldeans/Syriacs | 100.0 /100 | #9 | Exceptional 7.2% |
| Immigrants | Fiji | 100.0 /100 | #10 | Exceptional 7.3% |
| Immigrants | Taiwan | 100.0 /100 | #11 | Exceptional 7.3% |
| Bangladeshis | 100.0 /100 | #12 | Exceptional 7.4% |
| Indonesians | 100.0 /100 | #13 | Exceptional 7.4% |
| Sudanese | 100.0 /100 | #14 | Exceptional 7.4% |
| Puget Sound Salish | 100.0 /100 | #15 | Exceptional 7.5% |