Mexican vs Immigrants from Hong Kong In Labor Force | Age 35-44
COMPARE
Mexican
Immigrants from Hong Kong
In Labor Force | Age 35-44
In Labor Force | Age 35-44 Comparison
Mexicans
Immigrants from Hong Kong
81.6%
IN LABOR FORCE | AGE 35-44
0.0/ 100
METRIC RATING
313th/ 347
METRIC RANK
85.2%
IN LABOR FORCE | AGE 35-44
99.8/ 100
METRIC RATING
46th/ 347
METRIC RANK
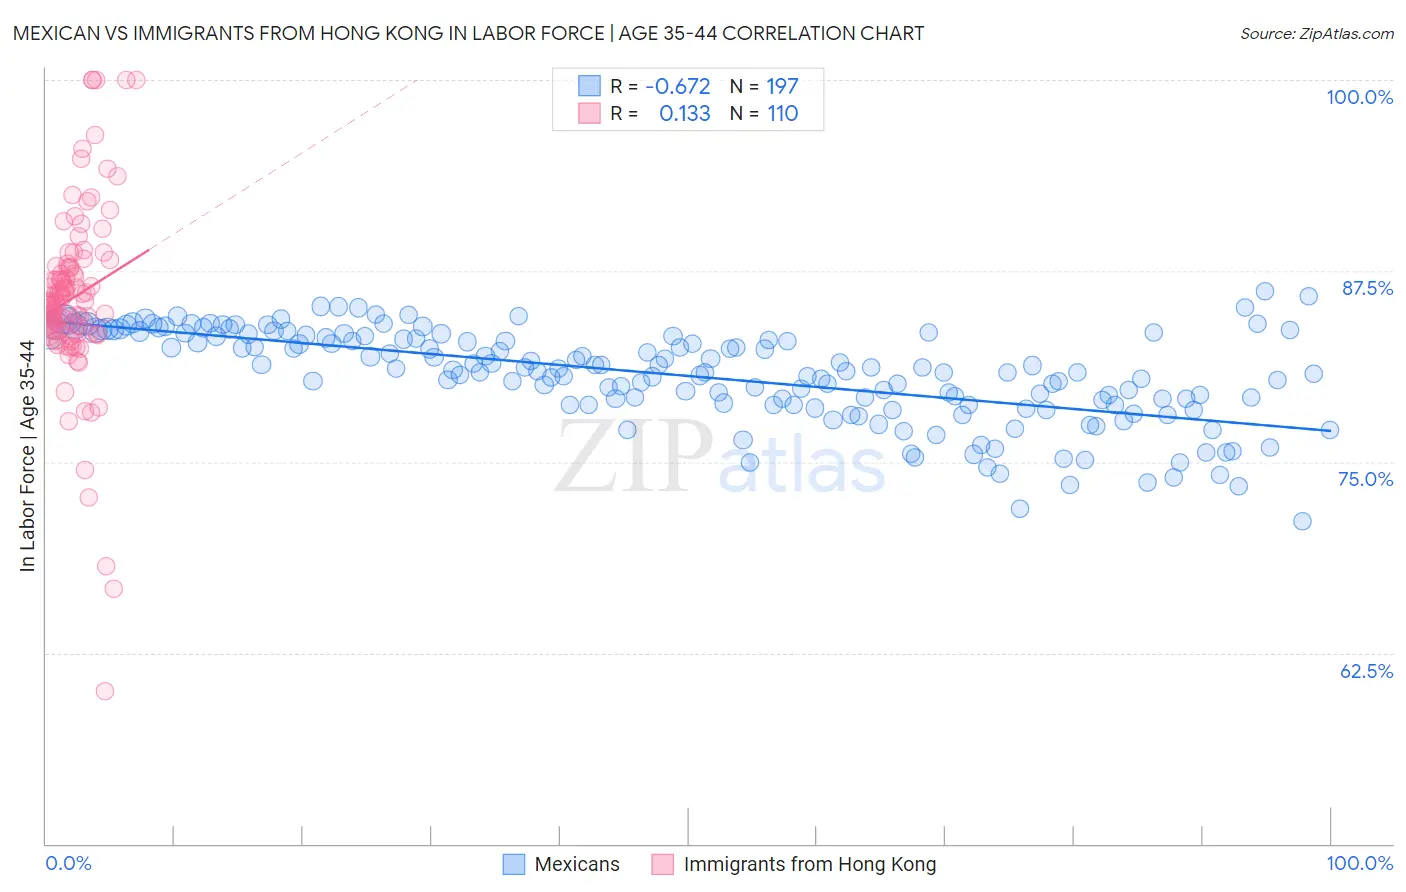
Mexican vs Immigrants from Hong Kong In Labor Force | Age 35-44 Correlation Chart
The statistical analysis conducted on geographies consisting of 564,555,689 people shows a significant negative correlation between the proportion of Mexicans and labor force participation rate among population between the ages 35 and 44 in the United States with a correlation coefficient (R) of -0.672 and weighted average of 81.6%. Similarly, the statistical analysis conducted on geographies consisting of 253,913,732 people shows a poor positive correlation between the proportion of Immigrants from Hong Kong and labor force participation rate among population between the ages 35 and 44 in the United States with a correlation coefficient (R) of 0.133 and weighted average of 85.2%, a difference of 4.4%.
In Labor Force | Age 35-44 Correlation Summary
| Measurement | Mexican | Immigrants from Hong Kong |
| Minimum | 71.1% | 60.0% |
| Maximum | 86.2% | 100.0% |
| Range | 15.0% | 40.0% |
| Mean | 80.7% | 85.8% |
| Median | 81.0% | 85.5% |
| Interquartile 25% (IQ1) | 78.8% | 83.6% |
| Interquartile 75% (IQ3) | 83.3% | 87.7% |
| Interquartile Range (IQR) | 4.5% | 4.1% |
| Standard Deviation (Sample) | 3.1% | 6.0% |
| Standard Deviation (Population) | 3.0% | 6.0% |
Similar Demographics by In Labor Force | Age 35-44
Demographics Similar to Mexicans by In Labor Force | Age 35-44
In terms of in labor force | age 35-44, the demographic groups most similar to Mexicans are Alaska Native (81.6%, a difference of 0.0%), Cajun (81.5%, a difference of 0.11%), Immigrants from Mexico (81.5%, a difference of 0.14%), Colville (81.7%, a difference of 0.15%), and Comanche (81.5%, a difference of 0.16%).
| Demographics | Rating | Rank | In Labor Force | Age 35-44 |
| Blacks/African Americans | 0.0 /100 | #306 | Tragic 82.2% |
| Hispanics or Latinos | 0.0 /100 | #307 | Tragic 82.1% |
| Immigrants | Central America | 0.0 /100 | #308 | Tragic 82.0% |
| Cree | 0.0 /100 | #309 | Tragic 82.0% |
| Blackfeet | 0.0 /100 | #310 | Tragic 81.9% |
| Colville | 0.0 /100 | #311 | Tragic 81.7% |
| Alaska Natives | 0.0 /100 | #312 | Tragic 81.6% |
| Mexicans | 0.0 /100 | #313 | Tragic 81.6% |
| Cajuns | 0.0 /100 | #314 | Tragic 81.5% |
| Immigrants | Mexico | 0.0 /100 | #315 | Tragic 81.5% |
| Comanche | 0.0 /100 | #316 | Tragic 81.5% |
| Cherokee | 0.0 /100 | #317 | Tragic 81.4% |
| Alaskan Athabascans | 0.0 /100 | #318 | Tragic 81.3% |
| Inupiat | 0.0 /100 | #319 | Tragic 80.9% |
| Chickasaw | 0.0 /100 | #320 | Tragic 80.9% |
Demographics Similar to Immigrants from Hong Kong by In Labor Force | Age 35-44
In terms of in labor force | age 35-44, the demographic groups most similar to Immigrants from Hong Kong are Cypriot (85.2%, a difference of 0.0%), German Russian (85.2%, a difference of 0.010%), Polish (85.2%, a difference of 0.020%), Lithuanian (85.2%, a difference of 0.020%), and Immigrants from Eritrea (85.2%, a difference of 0.020%).
| Demographics | Rating | Rank | In Labor Force | Age 35-44 |
| Eastern Europeans | 99.8 /100 | #39 | Exceptional 85.2% |
| Immigrants | Bulgaria | 99.8 /100 | #40 | Exceptional 85.2% |
| Immigrants | Zimbabwe | 99.8 /100 | #41 | Exceptional 85.2% |
| Macedonians | 99.8 /100 | #42 | Exceptional 85.2% |
| Poles | 99.8 /100 | #43 | Exceptional 85.2% |
| Lithuanians | 99.8 /100 | #44 | Exceptional 85.2% |
| Cypriots | 99.8 /100 | #45 | Exceptional 85.2% |
| Immigrants | Hong Kong | 99.8 /100 | #46 | Exceptional 85.2% |
| German Russians | 99.8 /100 | #47 | Exceptional 85.2% |
| Immigrants | Eritrea | 99.7 /100 | #48 | Exceptional 85.2% |
| Croatians | 99.7 /100 | #49 | Exceptional 85.2% |
| Thais | 99.7 /100 | #50 | Exceptional 85.2% |
| Immigrants | Albania | 99.7 /100 | #51 | Exceptional 85.1% |
| Immigrants | Kenya | 99.6 /100 | #52 | Exceptional 85.1% |
| Taiwanese | 99.6 /100 | #53 | Exceptional 85.1% |