Immigrants from Chile vs Immigrants from Uruguay Unemployment
COMPARE
Immigrants from Chile
Immigrants from Uruguay
Unemployment
Unemployment Comparison
Immigrants from Chile
Immigrants from Uruguay
5.1%
UNEMPLOYMENT
82.8/ 100
METRIC RATING
143rd/ 347
METRIC RANK
5.3%
UNEMPLOYMENT
29.8/ 100
METRIC RATING
197th/ 347
METRIC RANK
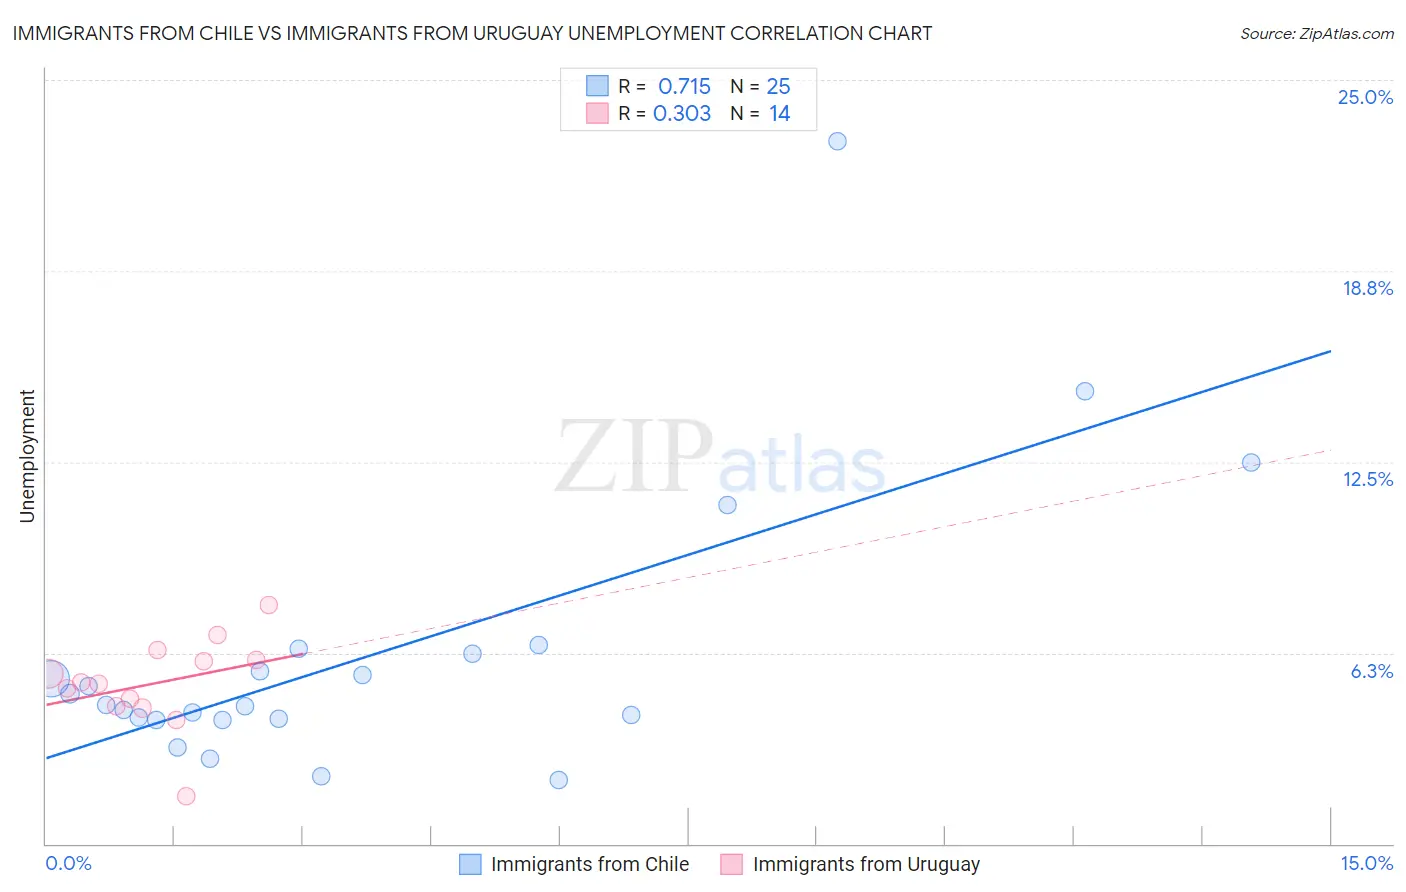
Immigrants from Chile vs Immigrants from Uruguay Unemployment Correlation Chart
The statistical analysis conducted on geographies consisting of 218,562,271 people shows a strong positive correlation between the proportion of Immigrants from Chile and unemployment in the United States with a correlation coefficient (R) of 0.715 and weighted average of 5.1%. Similarly, the statistical analysis conducted on geographies consisting of 133,243,021 people shows a mild positive correlation between the proportion of Immigrants from Uruguay and unemployment in the United States with a correlation coefficient (R) of 0.303 and weighted average of 5.3%, a difference of 3.8%.
Unemployment Correlation Summary
| Measurement | Immigrants from Chile | Immigrants from Uruguay |
| Minimum | 2.1% | 1.6% |
| Maximum | 23.0% | 7.8% |
| Range | 20.9% | 6.2% |
| Mean | 6.2% | 5.2% |
| Median | 4.5% | 5.3% |
| Interquartile 25% (IQ1) | 4.1% | 4.5% |
| Interquartile 75% (IQ3) | 6.3% | 6.0% |
| Interquartile Range (IQR) | 2.2% | 1.5% |
| Standard Deviation (Sample) | 4.6% | 1.5% |
| Standard Deviation (Population) | 4.5% | 1.4% |
Similar Demographics by Unemployment
Demographics Similar to Immigrants from Chile by Unemployment
In terms of unemployment, the demographic groups most similar to Immigrants from Chile are Immigrants from Pakistan (5.1%, a difference of 0.050%), Indonesian (5.1%, a difference of 0.050%), Palestinian (5.1%, a difference of 0.070%), Immigrants from Norway (5.1%, a difference of 0.11%), and Immigrants from Asia (5.1%, a difference of 0.11%).
| Demographics | Rating | Rank | Unemployment |
| Immigrants | Spain | 86.2 /100 | #136 | Excellent 5.1% |
| Immigrants | Saudi Arabia | 85.6 /100 | #137 | Excellent 5.1% |
| Immigrants | Hungary | 85.6 /100 | #138 | Excellent 5.1% |
| Pakistanis | 85.3 /100 | #139 | Excellent 5.1% |
| Immigrants | Denmark | 84.3 /100 | #140 | Excellent 5.1% |
| Palestinians | 83.4 /100 | #141 | Excellent 5.1% |
| Immigrants | Pakistan | 83.2 /100 | #142 | Excellent 5.1% |
| Immigrants | Chile | 82.8 /100 | #143 | Excellent 5.1% |
| Indonesians | 82.3 /100 | #144 | Excellent 5.1% |
| Immigrants | Norway | 81.8 /100 | #145 | Excellent 5.1% |
| Immigrants | Asia | 81.8 /100 | #146 | Excellent 5.1% |
| Indians (Asian) | 81.6 /100 | #147 | Excellent 5.1% |
| Immigrants | Italy | 79.1 /100 | #148 | Good 5.1% |
| Syrians | 77.7 /100 | #149 | Good 5.2% |
| Potawatomi | 76.2 /100 | #150 | Good 5.2% |
Demographics Similar to Immigrants from Uruguay by Unemployment
In terms of unemployment, the demographic groups most similar to Immigrants from Uruguay are Peruvian (5.3%, a difference of 0.010%), Immigrants from Laos (5.3%, a difference of 0.080%), Immigrants from Southern Europe (5.3%, a difference of 0.080%), Immigrants from Israel (5.3%, a difference of 0.090%), and Immigrants from Afghanistan (5.3%, a difference of 0.090%).
| Demographics | Rating | Rank | Unemployment |
| Arabs | 35.3 /100 | #190 | Fair 5.3% |
| Somalis | 34.0 /100 | #191 | Fair 5.3% |
| South Americans | 33.9 /100 | #192 | Fair 5.3% |
| Immigrants | Somalia | 33.8 /100 | #193 | Fair 5.3% |
| Immigrants | Laos | 30.9 /100 | #194 | Fair 5.3% |
| Immigrants | Southern Europe | 30.9 /100 | #195 | Fair 5.3% |
| Peruvians | 29.9 /100 | #196 | Fair 5.3% |
| Immigrants | Uruguay | 29.8 /100 | #197 | Fair 5.3% |
| Immigrants | Israel | 28.6 /100 | #198 | Fair 5.3% |
| Immigrants | Afghanistan | 28.6 /100 | #199 | Fair 5.3% |
| Koreans | 27.4 /100 | #200 | Fair 5.3% |
| Immigrants | South Eastern Asia | 27.0 /100 | #201 | Fair 5.3% |
| Cherokee | 25.5 /100 | #202 | Fair 5.3% |
| Immigrants | Micronesia | 25.2 /100 | #203 | Fair 5.3% |
| Immigrants | Ukraine | 24.9 /100 | #204 | Fair 5.3% |