Maltese vs Somali Unemployment
COMPARE
Maltese
Somali
Unemployment
Unemployment Comparison
Maltese
Somalis
5.0%
UNEMPLOYMENT
94.0/ 100
METRIC RATING
105th/ 347
METRIC RANK
5.3%
UNEMPLOYMENT
34.0/ 100
METRIC RATING
191st/ 347
METRIC RANK
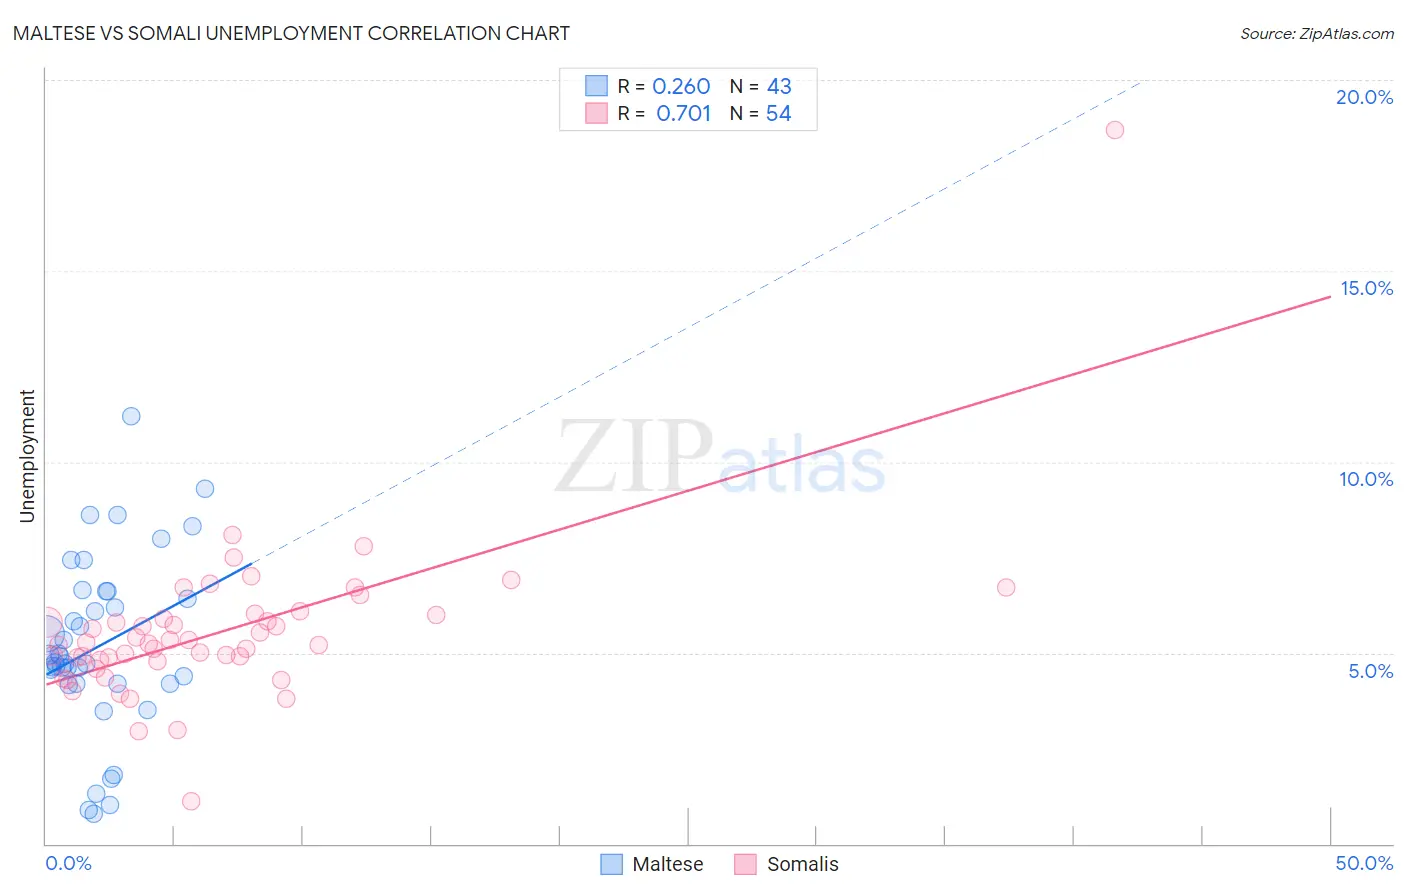
Maltese vs Somali Unemployment Correlation Chart
The statistical analysis conducted on geographies consisting of 126,436,055 people shows a weak positive correlation between the proportion of Maltese and unemployment in the United States with a correlation coefficient (R) of 0.260 and weighted average of 5.0%. Similarly, the statistical analysis conducted on geographies consisting of 99,308,248 people shows a strong positive correlation between the proportion of Somalis and unemployment in the United States with a correlation coefficient (R) of 0.701 and weighted average of 5.3%, a difference of 5.5%.
Unemployment Correlation Summary
| Measurement | Maltese | Somali |
| Minimum | 0.80% | 1.1% |
| Maximum | 11.2% | 18.7% |
| Range | 10.4% | 17.6% |
| Mean | 5.2% | 5.6% |
| Median | 4.7% | 5.3% |
| Interquartile 25% (IQ1) | 4.2% | 4.8% |
| Interquartile 75% (IQ3) | 6.6% | 6.0% |
| Interquartile Range (IQR) | 2.4% | 1.2% |
| Standard Deviation (Sample) | 2.3% | 2.2% |
| Standard Deviation (Population) | 2.3% | 2.2% |
Similar Demographics by Unemployment
Demographics Similar to Maltese by Unemployment
In terms of unemployment, the demographic groups most similar to Maltese are Chickasaw (5.0%, a difference of 0.0%), Osage (5.0%, a difference of 0.0%), Immigrants from Argentina (5.0%, a difference of 0.040%), Immigrants from Romania (5.0%, a difference of 0.070%), and Immigrants from Turkey (5.0%, a difference of 0.080%).
| Demographics | Rating | Rank | Unemployment |
| Romanians | 95.0 /100 | #98 | Exceptional 5.0% |
| Mongolians | 94.8 /100 | #99 | Exceptional 5.0% |
| Estonians | 94.6 /100 | #100 | Exceptional 5.0% |
| Americans | 94.3 /100 | #101 | Exceptional 5.0% |
| Immigrants | Argentina | 94.1 /100 | #102 | Exceptional 5.0% |
| Chickasaw | 94.0 /100 | #103 | Exceptional 5.0% |
| Osage | 94.0 /100 | #104 | Exceptional 5.0% |
| Maltese | 94.0 /100 | #105 | Exceptional 5.0% |
| Immigrants | Romania | 93.7 /100 | #106 | Exceptional 5.0% |
| Immigrants | Turkey | 93.7 /100 | #107 | Exceptional 5.0% |
| Immigrants | Kuwait | 93.7 /100 | #108 | Exceptional 5.0% |
| Immigrants | Eritrea | 93.3 /100 | #109 | Exceptional 5.0% |
| Immigrants | Lithuania | 93.2 /100 | #110 | Exceptional 5.0% |
| Chileans | 93.2 /100 | #111 | Exceptional 5.0% |
| South Africans | 92.6 /100 | #112 | Exceptional 5.1% |
Demographics Similar to Somalis by Unemployment
In terms of unemployment, the demographic groups most similar to Somalis are South American (5.3%, a difference of 0.0%), Immigrants from Somalia (5.3%, a difference of 0.010%), Arab (5.3%, a difference of 0.090%), Immigrants from Belarus (5.3%, a difference of 0.11%), and Alsatian (5.3%, a difference of 0.20%).
| Demographics | Rating | Rank | Unemployment |
| Assyrians/Chaldeans/Syriacs | 39.2 /100 | #184 | Fair 5.3% |
| Immigrants | Thailand | 38.9 /100 | #185 | Fair 5.3% |
| Immigrants | Uganda | 37.8 /100 | #186 | Fair 5.3% |
| Costa Ricans | 37.4 /100 | #187 | Fair 5.3% |
| Alsatians | 37.0 /100 | #188 | Fair 5.3% |
| Immigrants | Belarus | 35.6 /100 | #189 | Fair 5.3% |
| Arabs | 35.3 /100 | #190 | Fair 5.3% |
| Somalis | 34.0 /100 | #191 | Fair 5.3% |
| South Americans | 33.9 /100 | #192 | Fair 5.3% |
| Immigrants | Somalia | 33.8 /100 | #193 | Fair 5.3% |
| Immigrants | Laos | 30.9 /100 | #194 | Fair 5.3% |
| Immigrants | Southern Europe | 30.9 /100 | #195 | Fair 5.3% |
| Peruvians | 29.9 /100 | #196 | Fair 5.3% |
| Immigrants | Uruguay | 29.8 /100 | #197 | Fair 5.3% |
| Immigrants | Israel | 28.6 /100 | #198 | Fair 5.3% |