Malaysian vs Moroccan Unemployment Among Ages 55 to 59 years

COMPARE

Malaysian
Race
Ancestry
AfghanAfricanAlaska NativeAlaskan AthabascanAlbanianAleutAlsatianAmericanApacheArabArapahoArgentineanArmenianAssyrian/Chaldean/SyriacAustralianAustrianBahamianBangladeshiBarbadianBasqueBelgianBelizeanBermudanBhutaneseBlackfeetBolivianBrazilianBritishBritish West IndianBulgarianBurmeseCajunCambodianCanadianCape VerdeanCarpatho RusynCelticCentral AmericanCentral American IndianCherokeeCheyenneChickasawChileanChineseChippewaChoctawColombianColvilleComancheCosta RicanCreeCreekCroatianCrowCubanCypriotCzechCzechoslovakianDanishDelawareDominicanDutchDutch West IndianEastern EuropeanEcuadorianEgyptianEnglishEstonianEthiopianEuropeanFijianFilipinoFinnishFrenchFrench American IndianFrench CanadianGermanGerman RussianGhanaianGreekGuamanian/ChamorroGuatemalanGuyaneseHaitianHmongHonduranHopiHoumaHungarianIcelanderIndian (Asian)IndonesianInupiatIranianIraqiIrishIroquoisIsraeliItalianJamaicanJapaneseJordanianKenyanKiowaKoreanLaotianLatvianLebaneseLiberianLithuanianLumbeeLuxembourgerMacedonianMalaysianMalteseMarshalleseMenomineeMexicanMexican American IndianMongolianNative HawaiianNavajoNepaleseNew ZealanderNicaraguanNigerianNorthern EuropeanNorwegianOkinawanOsageOttawaPaiutePakistaniPalestinianPanamanianParaguayanPennsylvania GermanPeruvianPimaPolishPortuguesePotawatomiPuebloPuerto RicanPuget Sound SalishRomanianRussianSalvadoranSamoanScandinavianScotch-IrishScottishSeminoleSenegaleseSerbianShoshoneSierra LeoneanSiouxSlavicSlovakSloveneSomaliSouth AfricanSouth AmericanSouth American IndianSoviet UnionSpaniardSpanishSpanish AmericanSpanish American IndianSri LankanSubsaharan AfricanSudaneseSwedishSwissSyrianTaiwaneseThaiTlingit-HaidaTohono O'OdhamTonganTrinidadian and TobagonianTsimshianTurkishU.S. Virgin IslanderUgandanUkrainianUruguayanUteVenezuelanVietnameseWelshWest IndianYakamaYaquiYugoslavianYumanYup'ikZimbabwean
Immigration
NonimmigrantsImmigrantsAfghanistanAfricaAlbaniaArgentinaArmeniaAsiaAustraliaAustriaBahamasBangladeshBarbadosBelarusBelgiumBelizeBoliviaBosnia and HerzegovinaBrazilBulgariaBurma/MyanmarCabo VerdeCambodiaCameroonCanadaCaribbeanCentral AmericaChileChinaColombiaCongoCosta RicaCroatiaCubaCzechoslovakiaDenmarkDominicaDominican RepublicEastern AfricaEastern AsiaEastern EuropeEcuadorEgyptEl SalvadorEnglandEritreaEthiopiaEuropeFijiFranceGermanyGhanaGreeceGrenadaGuatemalaGuyanaHaitiHondurasHong KongHungaryIndiaIndonesiaIranIraqIrelandIsraelItalyJamaicaJapanJordanKazakhstanKenyaKoreaKuwaitLaosLatin AmericaLatviaLebanonLiberiaLithuaniaMalaysiaMexicoMicronesiaMiddle AfricaMoldovaMoroccoNepalNetherlandsNicaraguaNigeriaNorth AmericaNorth MacedoniaNorthern AfricaNorthern EuropeNorwayOceaniaPakistanPanamaPeruPhilippinesPolandPortugalRomaniaRussiaSaudi ArabiaScotlandSenegalSerbiaSierra LeoneSingaporeSomaliaSouth AfricaSouth AmericaSouth Central AsiaSouth Eastern AsiaSouthern EuropeSpainSri LankaSt. Vincent and the GrenadinesSudanSwedenSwitzerlandSyriaTaiwanThailandTrinidad and TobagoTurkeyUgandaUkraineUruguayUzbekistanVenezuelaVietnamWest IndiesWestern AfricaWestern AsiaWestern EuropeYemenZaireZimbabweAzores
Moroccan
Race
Ancestry
AfghanAfricanAlaska NativeAlaskan AthabascanAlbanianAleutAlsatianAmericanApacheArabArapahoArgentineanArmenianAssyrian/Chaldean/SyriacAustralianAustrianBahamianBangladeshiBarbadianBasqueBelgianBelizeanBermudanBhutaneseBlackfeetBolivianBrazilianBritishBritish West IndianBulgarianBurmeseCajunCambodianCanadianCape VerdeanCarpatho RusynCelticCentral AmericanCentral American IndianCherokeeCheyenneChickasawChileanChineseChippewaChoctawColombianColvilleComancheCosta RicanCreeCreekCroatianCrowCubanCypriotCzechCzechoslovakianDanishDelawareDominicanDutchDutch West IndianEastern EuropeanEcuadorianEgyptianEnglishEstonianEthiopianEuropeanFijianFilipinoFinnishFrenchFrench American IndianFrench CanadianGermanGerman RussianGhanaianGreekGuamanian/ChamorroGuatemalanGuyaneseHaitianHmongHonduranHopiHoumaHungarianIcelanderIndian (Asian)IndonesianInupiatIranianIraqiIrishIroquoisIsraeliItalianJamaicanJapaneseJordanianKenyanKiowaKoreanLaotianLatvianLebaneseLiberianLithuanianLumbeeLuxembourgerMacedonianMalteseMarshalleseMenomineeMexicanMexican American IndianMongolianMoroccanNative HawaiianNavajoNepaleseNew ZealanderNicaraguanNigerianNorthern EuropeanNorwegianOkinawanOsageOttawaPaiutePakistaniPalestinianPanamanianParaguayanPennsylvania GermanPeruvianPimaPolishPortuguesePotawatomiPuebloPuerto RicanPuget Sound SalishRomanianRussianSalvadoranSamoanScandinavianScotch-IrishScottishSeminoleSenegaleseSerbianShoshoneSierra LeoneanSiouxSlavicSlovakSloveneSomaliSouth AfricanSouth AmericanSouth American IndianSoviet UnionSpaniardSpanishSpanish AmericanSpanish American IndianSri LankanSubsaharan AfricanSudaneseSwedishSwissSyrianTaiwaneseThaiTlingit-HaidaTohono O'OdhamTonganTrinidadian and TobagonianTsimshianTurkishU.S. Virgin IslanderUgandanUkrainianUruguayanUteVenezuelanVietnameseWelshWest IndianYakamaYaquiYugoslavianYumanYup'ikZimbabwean
Immigration
NonimmigrantsImmigrantsAfghanistanAfricaAlbaniaArgentinaArmeniaAsiaAustraliaAustriaBahamasBangladeshBarbadosBelarusBelgiumBelizeBoliviaBosnia and HerzegovinaBrazilBulgariaBurma/MyanmarCabo VerdeCambodiaCameroonCanadaCaribbeanCentral AmericaChileChinaColombiaCongoCosta RicaCroatiaCubaCzechoslovakiaDenmarkDominicaDominican RepublicEastern AfricaEastern AsiaEastern EuropeEcuadorEgyptEl SalvadorEnglandEritreaEthiopiaEuropeFijiFranceGermanyGhanaGreeceGrenadaGuatemalaGuyanaHaitiHondurasHong KongHungaryIndiaIndonesiaIranIraqIrelandIsraelItalyJamaicaJapanJordanKazakhstanKenyaKoreaKuwaitLaosLatin AmericaLatviaLebanonLiberiaLithuaniaMalaysiaMexicoMicronesiaMiddle AfricaMoldovaMoroccoNepalNetherlandsNicaraguaNigeriaNorth AmericaNorth MacedoniaNorthern AfricaNorthern EuropeNorwayOceaniaPakistanPanamaPeruPhilippinesPolandPortugalRomaniaRussiaSaudi ArabiaScotlandSenegalSerbiaSierra LeoneSingaporeSomaliaSouth AfricaSouth AmericaSouth Central AsiaSouth Eastern AsiaSouthern EuropeSpainSri LankaSt. Vincent and the GrenadinesSudanSwedenSwitzerlandSyriaTaiwanThailandTrinidad and TobagoTurkeyUgandaUkraineUruguayUzbekistanVenezuelaVietnamWest IndiesWestern AfricaWestern AsiaWestern EuropeYemenZaireZimbabweAzores
Unemployment Among Ages 55 to 59 years
Income
Poverty
Unemployment
Labor Participation
Family Structure
Vehicle Availability
Education Level
Disability

Unemployment Among Ages 55 to 59 years Comparison

Malaysians

Moroccans

Exceptional
Tragic
4.7%
UNEMPLOYMENT AMONG AGES 55 TO 59 YEARS
96.9/ 100
METRIC RATING
84th/ 347
METRIC RANK
5.0%
UNEMPLOYMENT AMONG AGES 55 TO 59 YEARS
1.3/ 100
METRIC RATING
238th/ 347
METRIC RANK

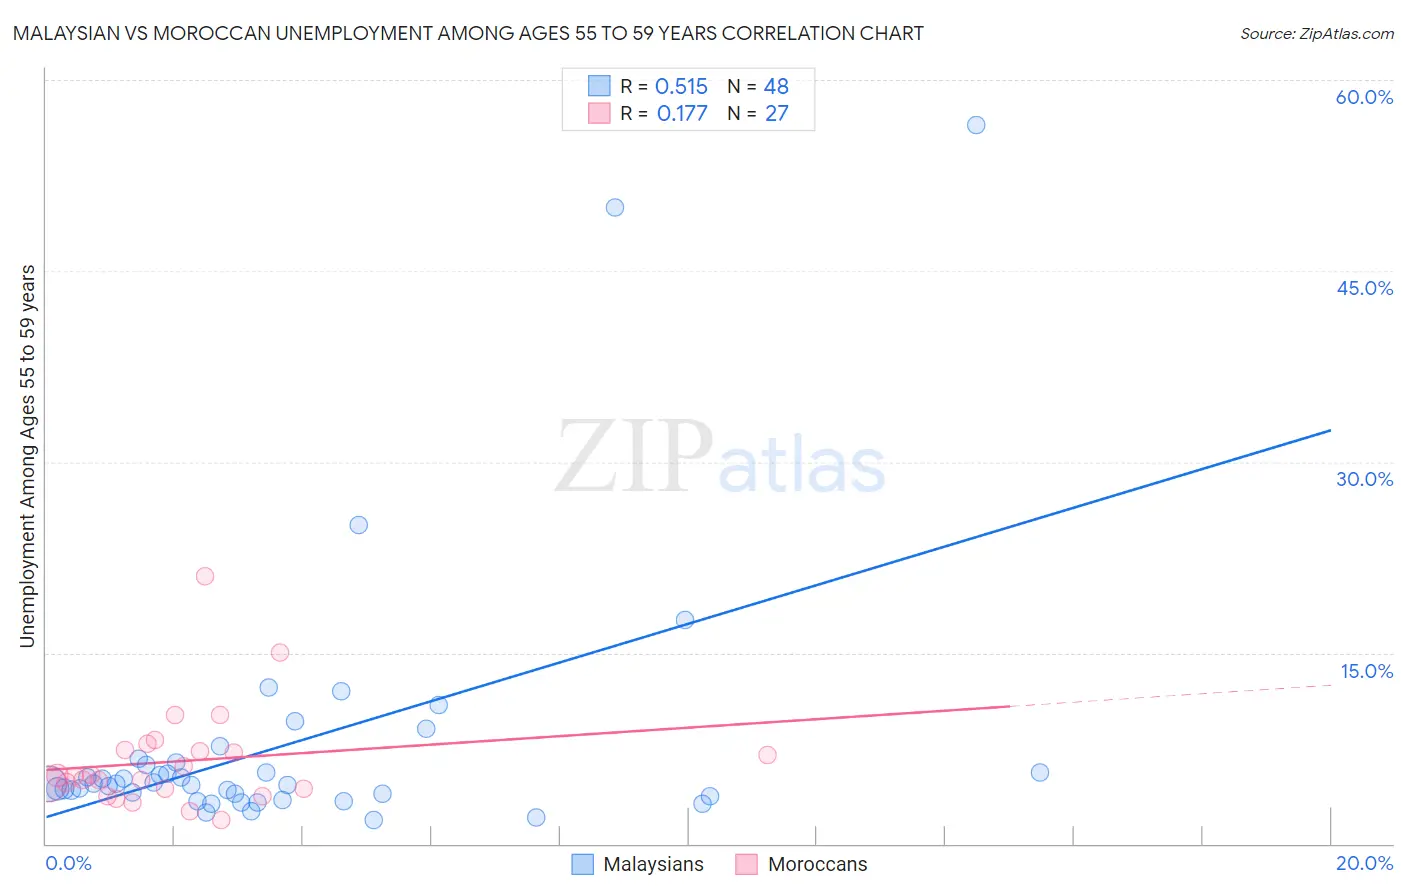
Malaysian vs Moroccan Unemployment Among Ages 55 to 59 years Correlation Chart

The statistical analysis conducted on geographies consisting of 217,088,048 people shows a substantial positive correlation between the proportion of Malaysians and unemployment rate among population between the ages 55 and 59 in the United States with a correlation coefficient (R) of 0.515 and weighted average of 4.7%. Similarly, the statistical analysis conducted on geographies consisting of 195,462,233 people shows a poor positive correlation between the proportion of Moroccans and unemployment rate among population between the ages 55 and 59 in the United States with a correlation coefficient (R) of 0.177 and weighted average of 5.0%, a difference of 8.2%.
Malaysian vs Moroccan Unemployment Among Ages 55 to 59 years

Unemployment Among Ages 55 to 59 years Correlation Summary

MeasurementMalaysianMoroccan
Minimum1.9%1.9%
Maximum56.5%21.0%
Range54.6%19.1%
Mean7.8%6.5%
Median4.7%5.3%
Interquartile 25% (IQ1)3.8%4.3%
Interquartile 75% (IQ3)6.3%7.4%
Interquartile Range (IQR)2.5%3.1%
Standard Deviation (Sample)10.4%4.0%
Standard Deviation (Population)10.3%3.9%

Similar Demographics by Unemployment Among Ages 55 to 59 years

Demographics Similar to Malaysians by Unemployment Among Ages 55 to 59 years

In terms of unemployment among ages 55 to 59 years, the demographic groups most similar to Malaysians are Immigrants from Vietnam (4.7%, a difference of 0.0%), Immigrants from Colombia (4.7%, a difference of 0.0%), Polish (4.7%, a difference of 0.030%), Immigrants from Cameroon (4.7%, a difference of 0.030%), and Irish (4.7%, a difference of 0.050%).
DemographicsRating | RankUnemployment Among Ages 55 to 59 years
Scotch-Irish
98.3
/100
|
#77
Exceptional
4.6%
Finns
98.2
/100
|
#78
Exceptional
4.6%
Sri Lankans
98.1
/100
|
#79
Exceptional
4.6%
Cambodians
98.0
/100
|
#80
Exceptional
4.6%
Taiwanese
97.9
/100
|
#81
Exceptional
4.6%
Latvians
97.8
/100
|
#82
Exceptional
4.6%
Lebanese
97.5
/100
|
#83
Exceptional
4.6%
Malaysians
96.9
/100
|
#84
Exceptional
4.7%
Immigrants | Vietnam
96.9
/100
|
#85
Exceptional
4.7%
Immigrants | Colombia
96.9
/100
|
#86
Exceptional
4.7%
Poles
96.9
/100
|
#87
Exceptional
4.7%
Immigrants | Cameroon
96.9
/100
|
#88
Exceptional
4.7%
Irish
96.8
/100
|
#89
Exceptional
4.7%
Immigrants | Poland
96.4
/100
|
#90
Exceptional
4.7%
New Zealanders
96.3
/100
|
#91
Exceptional
4.7%

Demographics Similar to Moroccans by Unemployment Among Ages 55 to 59 years

In terms of unemployment among ages 55 to 59 years, the demographic groups most similar to Moroccans are French American Indian (5.0%, a difference of 0.010%), Choctaw (5.0%, a difference of 0.020%), Immigrants from Albania (5.0%, a difference of 0.030%), Immigrants from Hong Kong (5.0%, a difference of 0.14%), and Immigrants from Costa Rica (5.0%, a difference of 0.14%).
DemographicsRating | RankUnemployment Among Ages 55 to 59 years
Cherokee
2.6
/100
|
#231
Tragic
5.0%
Albanians
2.5
/100
|
#232
Tragic
5.0%
Immigrants | Immigrants
2.3
/100
|
#233
Tragic
5.0%
Immigrants | Southern Europe
1.8
/100
|
#234
Tragic
5.0%
Immigrants | Hong Kong
1.4
/100
|
#235
Tragic
5.0%
Immigrants | Albania
1.3
/100
|
#236
Tragic
5.0%
Choctaw
1.3
/100
|
#237
Tragic
5.0%
Moroccans
1.3
/100
|
#238
Tragic
5.0%
French American Indians
1.2
/100
|
#239
Tragic
5.0%
Immigrants | Costa Rica
1.1
/100
|
#240
Tragic
5.0%
Brazilians
1.0
/100
|
#241
Tragic
5.0%
Liberians
0.9
/100
|
#242
Tragic
5.1%
Hondurans
0.7
/100
|
#243
Tragic
5.1%
Immigrants | Fiji
0.7
/100
|
#244
Tragic
5.1%
Soviet Union
0.6
/100
|
#245
Tragic
5.1%