Malaysian vs Scotch-Irish Unemployment Among Ages 55 to 59 years
COMPARE
Malaysian
Scotch-Irish
Unemployment Among Ages 55 to 59 years
Unemployment Among Ages 55 to 59 years Comparison
Malaysians
Scotch-Irish
4.7%
UNEMPLOYMENT AMONG AGES 55 TO 59 YEARS
96.9/ 100
METRIC RATING
84th/ 347
METRIC RANK
4.6%
UNEMPLOYMENT AMONG AGES 55 TO 59 YEARS
98.3/ 100
METRIC RATING
77th/ 347
METRIC RANK
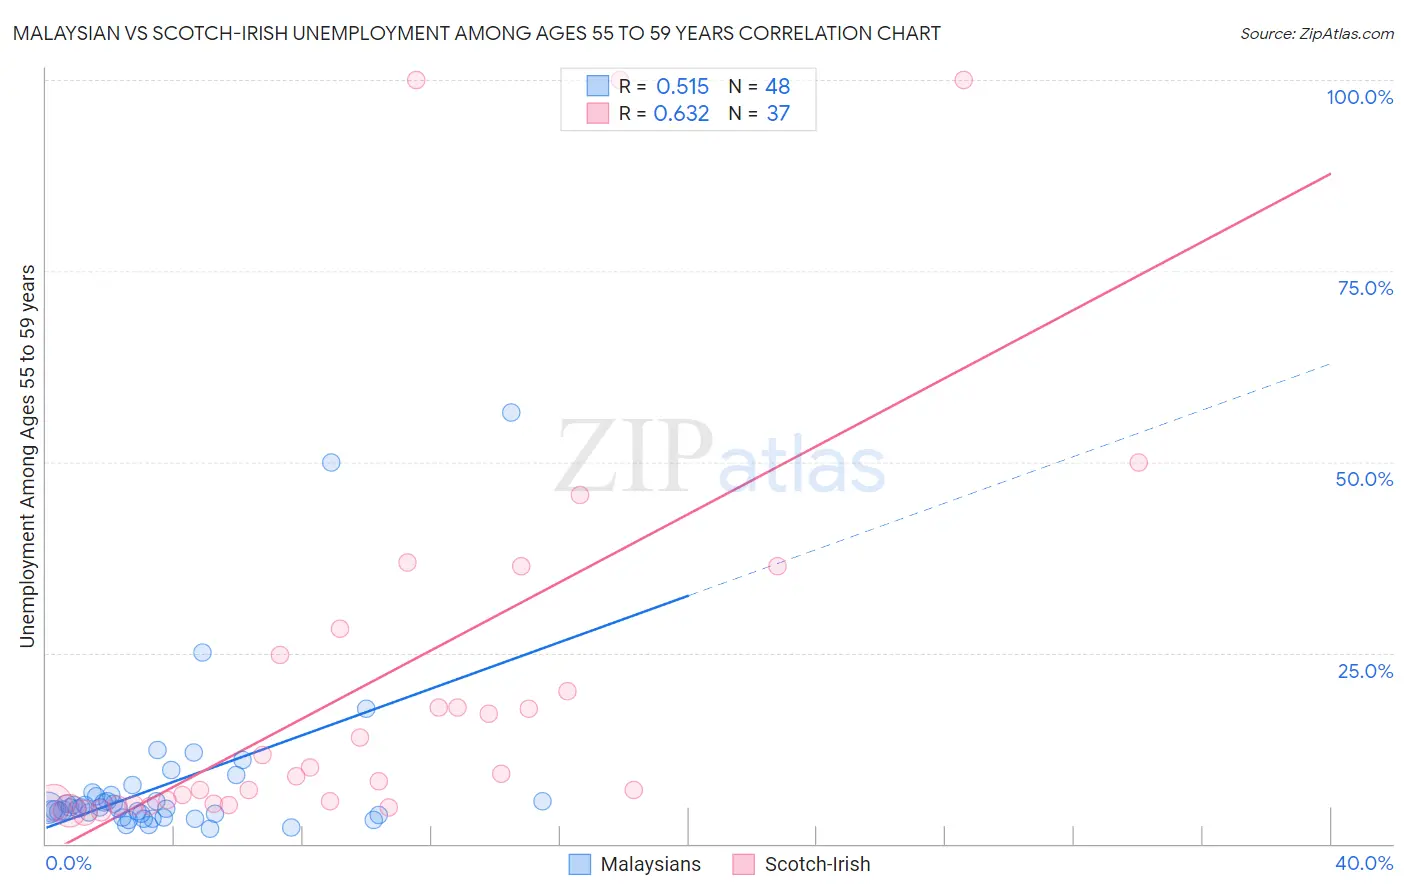
Malaysian vs Scotch-Irish Unemployment Among Ages 55 to 59 years Correlation Chart
The statistical analysis conducted on geographies consisting of 217,088,048 people shows a substantial positive correlation between the proportion of Malaysians and unemployment rate among population between the ages 55 and 59 in the United States with a correlation coefficient (R) of 0.515 and weighted average of 4.7%. Similarly, the statistical analysis conducted on geographies consisting of 470,743,617 people shows a significant positive correlation between the proportion of Scotch-Irish and unemployment rate among population between the ages 55 and 59 in the United States with a correlation coefficient (R) of 0.632 and weighted average of 4.6%, a difference of 0.66%.
Unemployment Among Ages 55 to 59 years Correlation Summary
| Measurement | Malaysian | Scotch-Irish |
| Minimum | 1.9% | 4.0% |
| Maximum | 56.5% | 100.0% |
| Range | 54.6% | 96.0% |
| Mean | 7.8% | 21.6% |
| Median | 4.7% | 9.2% |
| Interquartile 25% (IQ1) | 3.8% | 5.3% |
| Interquartile 75% (IQ3) | 6.3% | 26.5% |
| Interquartile Range (IQR) | 2.5% | 21.2% |
| Standard Deviation (Sample) | 10.4% | 26.7% |
| Standard Deviation (Population) | 10.3% | 26.3% |
Demographics Similar to Malaysians and Scotch-Irish by Unemployment Among Ages 55 to 59 years
In terms of unemployment among ages 55 to 59 years, the demographic groups most similar to Malaysians are Immigrants from Vietnam (4.7%, a difference of 0.0%), Immigrants from Colombia (4.7%, a difference of 0.0%), Polish (4.7%, a difference of 0.030%), Immigrants from Cameroon (4.7%, a difference of 0.030%), and Irish (4.7%, a difference of 0.050%). Similarly, the demographic groups most similar to Scotch-Irish are Immigrants from Bosnia and Herzegovina (4.6%, a difference of 0.010%), Finnish (4.6%, a difference of 0.050%), Immigrants from Iraq (4.6%, a difference of 0.080%), Croatian (4.6%, a difference of 0.10%), and Sri Lankan (4.6%, a difference of 0.14%).
| Demographics | Rating | Rank | Unemployment Among Ages 55 to 59 years |
| Filipinos | 98.8 /100 | #70 | Exceptional 4.6% |
| Immigrants | Jordan | 98.7 /100 | #71 | Exceptional 4.6% |
| Immigrants | Taiwan | 98.7 /100 | #72 | Exceptional 4.6% |
| Bhutanese | 98.6 /100 | #73 | Exceptional 4.6% |
| Croatians | 98.5 /100 | #74 | Exceptional 4.6% |
| Immigrants | Iraq | 98.5 /100 | #75 | Exceptional 4.6% |
| Immigrants | Bosnia and Herzegovina | 98.3 /100 | #76 | Exceptional 4.6% |
| Scotch-Irish | 98.3 /100 | #77 | Exceptional 4.6% |
| Finns | 98.2 /100 | #78 | Exceptional 4.6% |
| Sri Lankans | 98.1 /100 | #79 | Exceptional 4.6% |
| Cambodians | 98.0 /100 | #80 | Exceptional 4.6% |
| Taiwanese | 97.9 /100 | #81 | Exceptional 4.6% |
| Latvians | 97.8 /100 | #82 | Exceptional 4.6% |
| Lebanese | 97.5 /100 | #83 | Exceptional 4.6% |
| Malaysians | 96.9 /100 | #84 | Exceptional 4.7% |
| Immigrants | Vietnam | 96.9 /100 | #85 | Exceptional 4.7% |
| Immigrants | Colombia | 96.9 /100 | #86 | Exceptional 4.7% |
| Poles | 96.9 /100 | #87 | Exceptional 4.7% |
| Immigrants | Cameroon | 96.9 /100 | #88 | Exceptional 4.7% |
| Irish | 96.8 /100 | #89 | Exceptional 4.7% |
| Immigrants | Poland | 96.4 /100 | #90 | Exceptional 4.7% |