Immigrants from Cabo Verde vs Moroccan Unemployment Among Ages 55 to 59 years
COMPARE
Immigrants from Cabo Verde
Moroccan
Unemployment Among Ages 55 to 59 years
Unemployment Among Ages 55 to 59 years Comparison
Immigrants from Cabo Verde
Moroccans
5.5%
UNEMPLOYMENT AMONG AGES 55 TO 59 YEARS
0.0/ 100
METRIC RATING
306th/ 347
METRIC RANK
5.0%
UNEMPLOYMENT AMONG AGES 55 TO 59 YEARS
1.3/ 100
METRIC RATING
238th/ 347
METRIC RANK
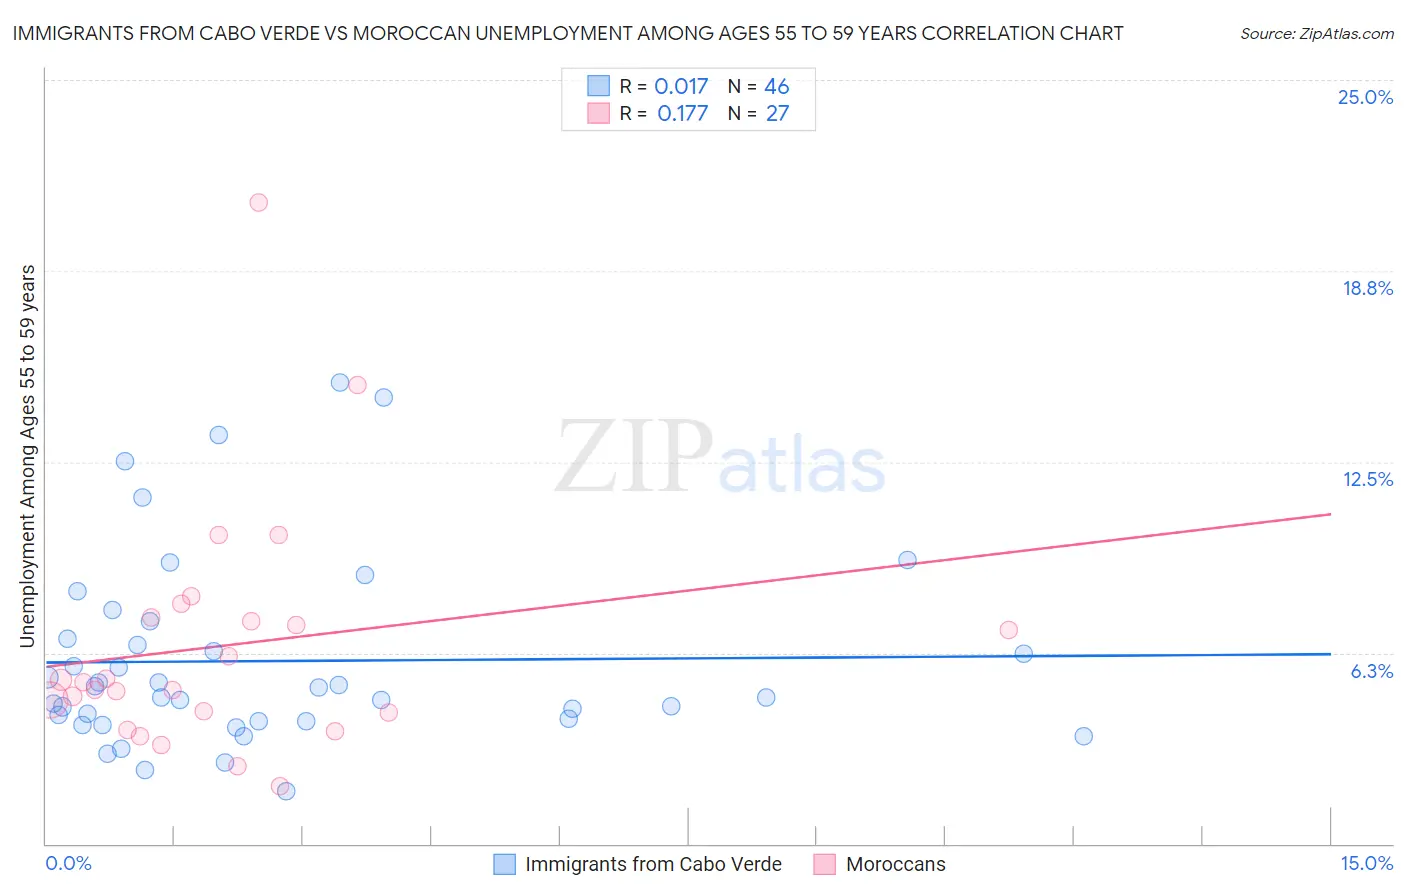
Immigrants from Cabo Verde vs Moroccan Unemployment Among Ages 55 to 59 years Correlation Chart
The statistical analysis conducted on geographies consisting of 37,450,207 people shows no correlation between the proportion of Immigrants from Cabo Verde and unemployment rate among population between the ages 55 and 59 in the United States with a correlation coefficient (R) of 0.017 and weighted average of 5.5%. Similarly, the statistical analysis conducted on geographies consisting of 195,462,233 people shows a poor positive correlation between the proportion of Moroccans and unemployment rate among population between the ages 55 and 59 in the United States with a correlation coefficient (R) of 0.177 and weighted average of 5.0%, a difference of 9.6%.
Unemployment Among Ages 55 to 59 years Correlation Summary
| Measurement | Immigrants from Cabo Verde | Moroccan |
| Minimum | 1.7% | 1.9% |
| Maximum | 15.1% | 21.0% |
| Range | 13.4% | 19.1% |
| Mean | 6.0% | 6.5% |
| Median | 5.0% | 5.3% |
| Interquartile 25% (IQ1) | 4.0% | 4.3% |
| Interquartile 75% (IQ3) | 6.7% | 7.4% |
| Interquartile Range (IQR) | 2.7% | 3.1% |
| Standard Deviation (Sample) | 3.1% | 4.0% |
| Standard Deviation (Population) | 3.1% | 3.9% |
Similar Demographics by Unemployment Among Ages 55 to 59 years
Demographics Similar to Immigrants from Cabo Verde by Unemployment Among Ages 55 to 59 years
In terms of unemployment among ages 55 to 59 years, the demographic groups most similar to Immigrants from Cabo Verde are Immigrants from Portugal (5.5%, a difference of 0.12%), Immigrants from Belize (5.5%, a difference of 0.22%), Black/African American (5.5%, a difference of 0.29%), Spanish American Indian (5.6%, a difference of 0.72%), and Marshallese (5.5%, a difference of 0.81%).
| Demographics | Rating | Rank | Unemployment Among Ages 55 to 59 years |
| Cape Verdeans | 0.0 /100 | #299 | Tragic 5.4% |
| Immigrants | St. Vincent and the Grenadines | 0.0 /100 | #300 | Tragic 5.4% |
| Immigrants | Dominica | 0.0 /100 | #301 | Tragic 5.5% |
| Sierra Leoneans | 0.0 /100 | #302 | Tragic 5.5% |
| Marshallese | 0.0 /100 | #303 | Tragic 5.5% |
| Blacks/African Americans | 0.0 /100 | #304 | Tragic 5.5% |
| Immigrants | Portugal | 0.0 /100 | #305 | Tragic 5.5% |
| Immigrants | Cabo Verde | 0.0 /100 | #306 | Tragic 5.5% |
| Immigrants | Belize | 0.0 /100 | #307 | Tragic 5.5% |
| Spanish American Indians | 0.0 /100 | #308 | Tragic 5.6% |
| Nepalese | 0.0 /100 | #309 | Tragic 5.6% |
| Belizeans | 0.0 /100 | #310 | Tragic 5.6% |
| Houma | 0.0 /100 | #311 | Tragic 5.6% |
| Ecuadorians | 0.0 /100 | #312 | Tragic 5.6% |
| Central American Indians | 0.0 /100 | #313 | Tragic 5.6% |
Demographics Similar to Moroccans by Unemployment Among Ages 55 to 59 years
In terms of unemployment among ages 55 to 59 years, the demographic groups most similar to Moroccans are French American Indian (5.0%, a difference of 0.010%), Choctaw (5.0%, a difference of 0.020%), Immigrants from Albania (5.0%, a difference of 0.030%), Immigrants from Hong Kong (5.0%, a difference of 0.14%), and Immigrants from Costa Rica (5.0%, a difference of 0.14%).
| Demographics | Rating | Rank | Unemployment Among Ages 55 to 59 years |
| Cherokee | 2.6 /100 | #231 | Tragic 5.0% |
| Albanians | 2.5 /100 | #232 | Tragic 5.0% |
| Immigrants | Immigrants | 2.3 /100 | #233 | Tragic 5.0% |
| Immigrants | Southern Europe | 1.8 /100 | #234 | Tragic 5.0% |
| Immigrants | Hong Kong | 1.4 /100 | #235 | Tragic 5.0% |
| Immigrants | Albania | 1.3 /100 | #236 | Tragic 5.0% |
| Choctaw | 1.3 /100 | #237 | Tragic 5.0% |
| Moroccans | 1.3 /100 | #238 | Tragic 5.0% |
| French American Indians | 1.2 /100 | #239 | Tragic 5.0% |
| Immigrants | Costa Rica | 1.1 /100 | #240 | Tragic 5.0% |
| Brazilians | 1.0 /100 | #241 | Tragic 5.0% |
| Liberians | 0.9 /100 | #242 | Tragic 5.1% |
| Hondurans | 0.7 /100 | #243 | Tragic 5.1% |
| Immigrants | Fiji | 0.7 /100 | #244 | Tragic 5.1% |
| Soviet Union | 0.6 /100 | #245 | Tragic 5.1% |