Malaysian vs Sudanese Unemployment Among Ages 55 to 59 years
COMPARE
Malaysian
Sudanese
Unemployment Among Ages 55 to 59 years
Unemployment Among Ages 55 to 59 years Comparison
Malaysians
Sudanese
4.7%
UNEMPLOYMENT AMONG AGES 55 TO 59 YEARS
96.9/ 100
METRIC RATING
84th/ 347
METRIC RANK
4.6%
UNEMPLOYMENT AMONG AGES 55 TO 59 YEARS
99.1/ 100
METRIC RATING
65th/ 347
METRIC RANK
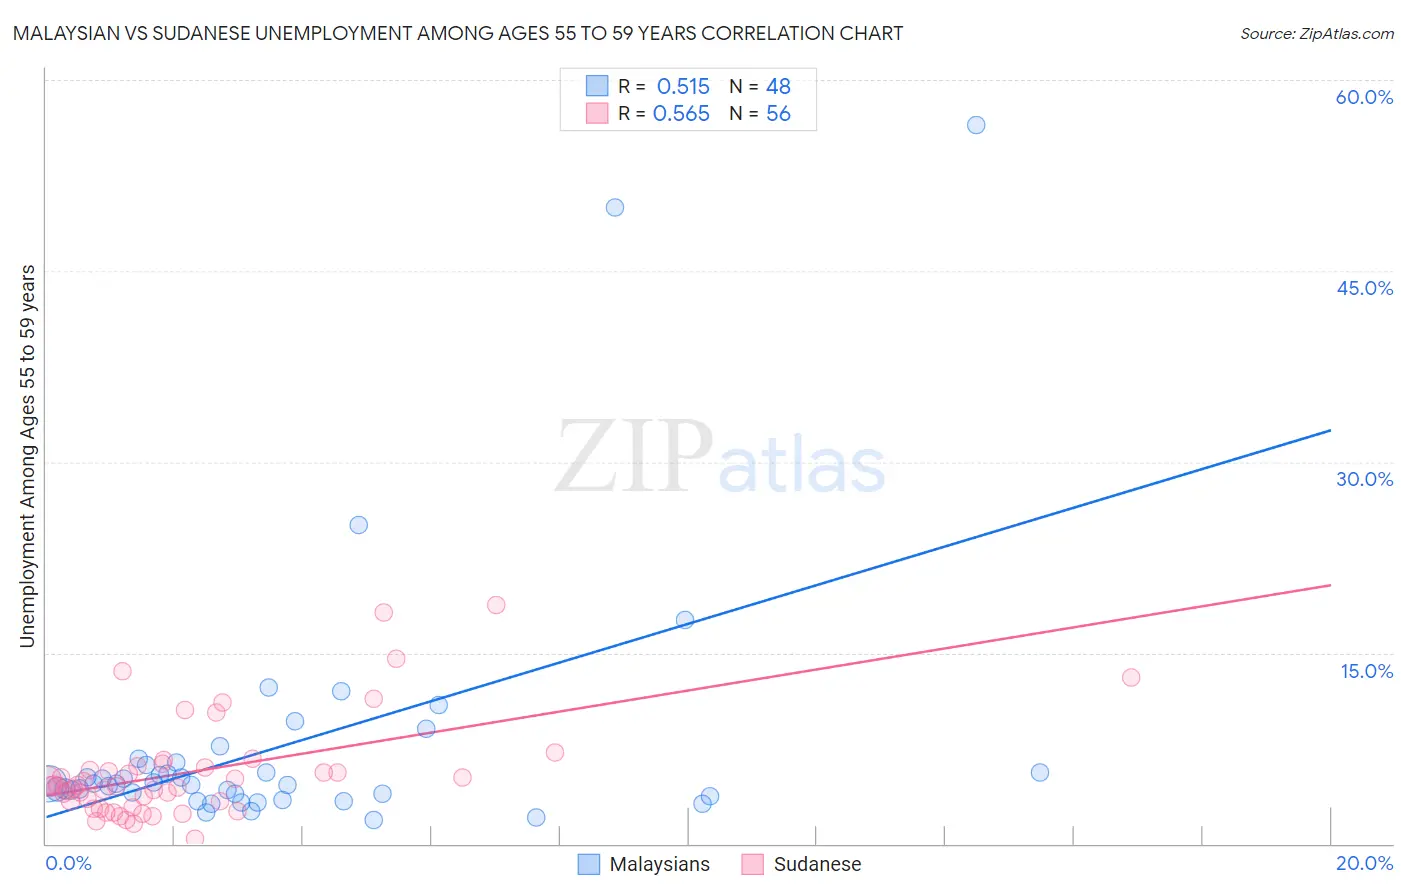
Malaysian vs Sudanese Unemployment Among Ages 55 to 59 years Correlation Chart
The statistical analysis conducted on geographies consisting of 217,088,048 people shows a substantial positive correlation between the proportion of Malaysians and unemployment rate among population between the ages 55 and 59 in the United States with a correlation coefficient (R) of 0.515 and weighted average of 4.7%. Similarly, the statistical analysis conducted on geographies consisting of 107,452,803 people shows a substantial positive correlation between the proportion of Sudanese and unemployment rate among population between the ages 55 and 59 in the United States with a correlation coefficient (R) of 0.565 and weighted average of 4.6%, a difference of 1.4%.
Unemployment Among Ages 55 to 59 years Correlation Summary
| Measurement | Malaysian | Sudanese |
| Minimum | 1.9% | 0.40% |
| Maximum | 56.5% | 18.8% |
| Range | 54.6% | 18.4% |
| Mean | 7.8% | 5.6% |
| Median | 4.7% | 4.5% |
| Interquartile 25% (IQ1) | 3.8% | 3.1% |
| Interquartile 75% (IQ3) | 6.3% | 6.0% |
| Interquartile Range (IQR) | 2.5% | 3.0% |
| Standard Deviation (Sample) | 10.4% | 4.0% |
| Standard Deviation (Population) | 10.3% | 3.9% |
Demographics Similar to Malaysians and Sudanese by Unemployment Among Ages 55 to 59 years
In terms of unemployment among ages 55 to 59 years, the demographic groups most similar to Malaysians are Lebanese (4.6%, a difference of 0.24%), Latvian (4.6%, a difference of 0.36%), Taiwanese (4.6%, a difference of 0.40%), Cambodian (4.6%, a difference of 0.47%), and Sri Lankan (4.6%, a difference of 0.52%). Similarly, the demographic groups most similar to Sudanese are Argentinean (4.6%, a difference of 0.010%), Mongolian (4.6%, a difference of 0.14%), Ugandan (4.6%, a difference of 0.17%), Immigrants from Micronesia (4.6%, a difference of 0.18%), and Czechoslovakian (4.6%, a difference of 0.19%).
| Demographics | Rating | Rank | Unemployment Among Ages 55 to 59 years |
| Argentineans | 99.1 /100 | #64 | Exceptional 4.6% |
| Sudanese | 99.1 /100 | #65 | Exceptional 4.6% |
| Mongolians | 99.0 /100 | #66 | Exceptional 4.6% |
| Ugandans | 99.0 /100 | #67 | Exceptional 4.6% |
| Immigrants | Micronesia | 99.0 /100 | #68 | Exceptional 4.6% |
| Czechoslovakians | 99.0 /100 | #69 | Exceptional 4.6% |
| Filipinos | 98.8 /100 | #70 | Exceptional 4.6% |
| Immigrants | Jordan | 98.7 /100 | #71 | Exceptional 4.6% |
| Immigrants | Taiwan | 98.7 /100 | #72 | Exceptional 4.6% |
| Bhutanese | 98.6 /100 | #73 | Exceptional 4.6% |
| Croatians | 98.5 /100 | #74 | Exceptional 4.6% |
| Immigrants | Iraq | 98.5 /100 | #75 | Exceptional 4.6% |
| Immigrants | Bosnia and Herzegovina | 98.3 /100 | #76 | Exceptional 4.6% |
| Scotch-Irish | 98.3 /100 | #77 | Exceptional 4.6% |
| Finns | 98.2 /100 | #78 | Exceptional 4.6% |
| Sri Lankans | 98.1 /100 | #79 | Exceptional 4.6% |
| Cambodians | 98.0 /100 | #80 | Exceptional 4.6% |
| Taiwanese | 97.9 /100 | #81 | Exceptional 4.6% |
| Latvians | 97.8 /100 | #82 | Exceptional 4.6% |
| Lebanese | 97.5 /100 | #83 | Exceptional 4.6% |
| Malaysians | 96.9 /100 | #84 | Exceptional 4.7% |