Luxembourger vs Immigrants from Uganda Nursery School
COMPARE
Luxembourger
Immigrants from Uganda
Nursery School
Nursery School Comparison
Luxembourgers
Immigrants from Uganda
98.5%
NURSERY SCHOOL
99.9/ 100
METRIC RATING
41st/ 347
METRIC RANK
97.9%
NURSERY SCHOOL
18.0/ 100
METRIC RATING
203rd/ 347
METRIC RANK
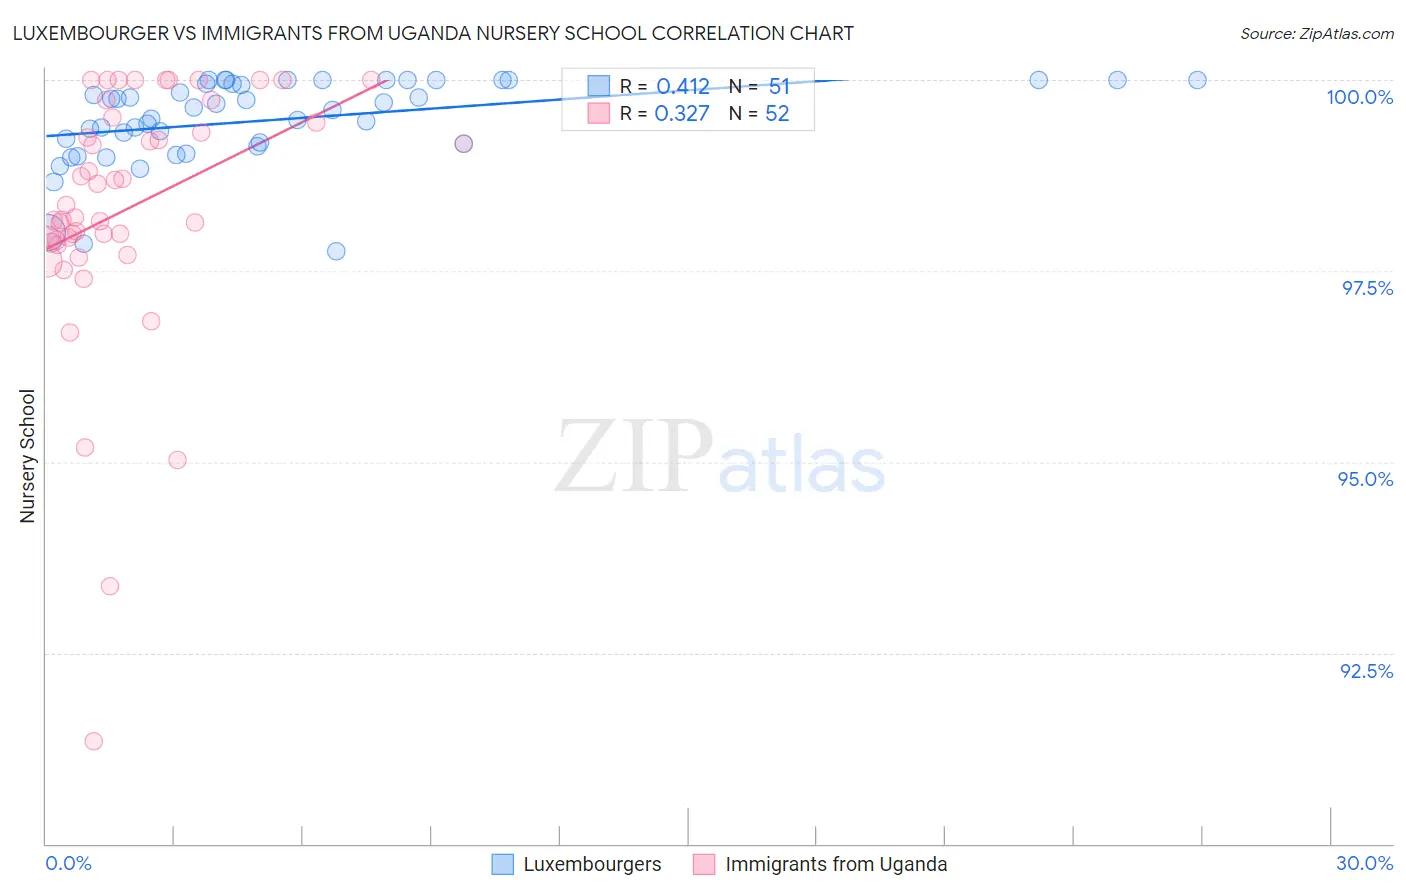
Luxembourger vs Immigrants from Uganda Nursery School Correlation Chart
The statistical analysis conducted on geographies consisting of 144,675,804 people shows a moderate positive correlation between the proportion of Luxembourgers and percentage of population with at least nursery school education in the United States with a correlation coefficient (R) of 0.412 and weighted average of 98.5%. Similarly, the statistical analysis conducted on geographies consisting of 125,941,298 people shows a mild positive correlation between the proportion of Immigrants from Uganda and percentage of population with at least nursery school education in the United States with a correlation coefficient (R) of 0.327 and weighted average of 97.9%, a difference of 0.65%.
Nursery School Correlation Summary
| Measurement | Luxembourger | Immigrants from Uganda |
| Minimum | 97.8% | 91.3% |
| Maximum | 100.0% | 100.0% |
| Range | 2.2% | 8.7% |
| Mean | 99.5% | 98.3% |
| Median | 99.6% | 98.3% |
| Interquartile 25% (IQ1) | 99.2% | 97.9% |
| Interquartile 75% (IQ3) | 100.0% | 99.5% |
| Interquartile Range (IQR) | 0.83% | 1.6% |
| Standard Deviation (Sample) | 0.56% | 1.7% |
| Standard Deviation (Population) | 0.56% | 1.7% |
Similar Demographics by Nursery School
Demographics Similar to Luxembourgers by Nursery School
In terms of nursery school, the demographic groups most similar to Luxembourgers are Eastern European (98.5%, a difference of 0.0%), Latvian (98.5%, a difference of 0.010%), Chippewa (98.5%, a difference of 0.010%), Native Hawaiian (98.5%, a difference of 0.010%), and Belgian (98.5%, a difference of 0.010%).
| Demographics | Rating | Rank | Nursery School |
| Chinese | 100.0 /100 | #34 | Exceptional 98.6% |
| Swiss | 100.0 /100 | #35 | Exceptional 98.6% |
| British | 100.0 /100 | #36 | Exceptional 98.5% |
| Lumbee | 99.9 /100 | #37 | Exceptional 98.5% |
| Italians | 99.9 /100 | #38 | Exceptional 98.5% |
| Latvians | 99.9 /100 | #39 | Exceptional 98.5% |
| Chippewa | 99.9 /100 | #40 | Exceptional 98.5% |
| Luxembourgers | 99.9 /100 | #41 | Exceptional 98.5% |
| Eastern Europeans | 99.9 /100 | #42 | Exceptional 98.5% |
| Native Hawaiians | 99.9 /100 | #43 | Exceptional 98.5% |
| Belgians | 99.9 /100 | #44 | Exceptional 98.5% |
| Northern Europeans | 99.9 /100 | #45 | Exceptional 98.5% |
| Hungarians | 99.9 /100 | #46 | Exceptional 98.5% |
| Czechoslovakians | 99.9 /100 | #47 | Exceptional 98.5% |
| Ottawa | 99.8 /100 | #48 | Exceptional 98.5% |
Demographics Similar to Immigrants from Uganda by Nursery School
In terms of nursery school, the demographic groups most similar to Immigrants from Uganda are Immigrants from Southern Europe (97.9%, a difference of 0.0%), Immigrants from Chile (97.9%, a difference of 0.0%), Immigrants from Ukraine (97.9%, a difference of 0.010%), Immigrants from Albania (97.9%, a difference of 0.010%), and African (97.9%, a difference of 0.010%).
| Demographics | Rating | Rank | Nursery School |
| Guamanians/Chamorros | 25.7 /100 | #196 | Fair 97.9% |
| Yuman | 25.7 /100 | #197 | Fair 97.9% |
| Immigrants | Kenya | 24.1 /100 | #198 | Fair 97.9% |
| Immigrants | Egypt | 22.5 /100 | #199 | Fair 97.9% |
| Tohono O'odham | 22.2 /100 | #200 | Fair 97.9% |
| Immigrants | Lebanon | 21.2 /100 | #201 | Fair 97.9% |
| Immigrants | Ukraine | 19.9 /100 | #202 | Poor 97.9% |
| Immigrants | Uganda | 18.0 /100 | #203 | Poor 97.9% |
| Immigrants | Southern Europe | 17.4 /100 | #204 | Poor 97.9% |
| Immigrants | Chile | 17.3 /100 | #205 | Poor 97.9% |
| Immigrants | Albania | 16.4 /100 | #206 | Poor 97.9% |
| Africans | 15.4 /100 | #207 | Poor 97.9% |
| Immigrants | Northern Africa | 11.7 /100 | #208 | Poor 97.8% |
| Costa Ricans | 11.3 /100 | #209 | Poor 97.8% |
| Immigrants | Oceania | 10.2 /100 | #210 | Poor 97.8% |