Lithuanian vs Immigrants from Sierra Leone Seniors Poverty Over the Age of 65
COMPARE
Lithuanian
Immigrants from Sierra Leone
Seniors Poverty Over the Age of 65
Seniors Poverty Over the Age of 65 Comparison
Lithuanians
Immigrants from Sierra Leone
9.1%
SENIORS POVERTY OVER THE AGE OF 65
100.0/ 100
METRIC RATING
10th/ 347
METRIC RANK
10.7%
SENIORS POVERTY OVER THE AGE OF 65
71.7/ 100
METRIC RATING
158th/ 347
METRIC RANK
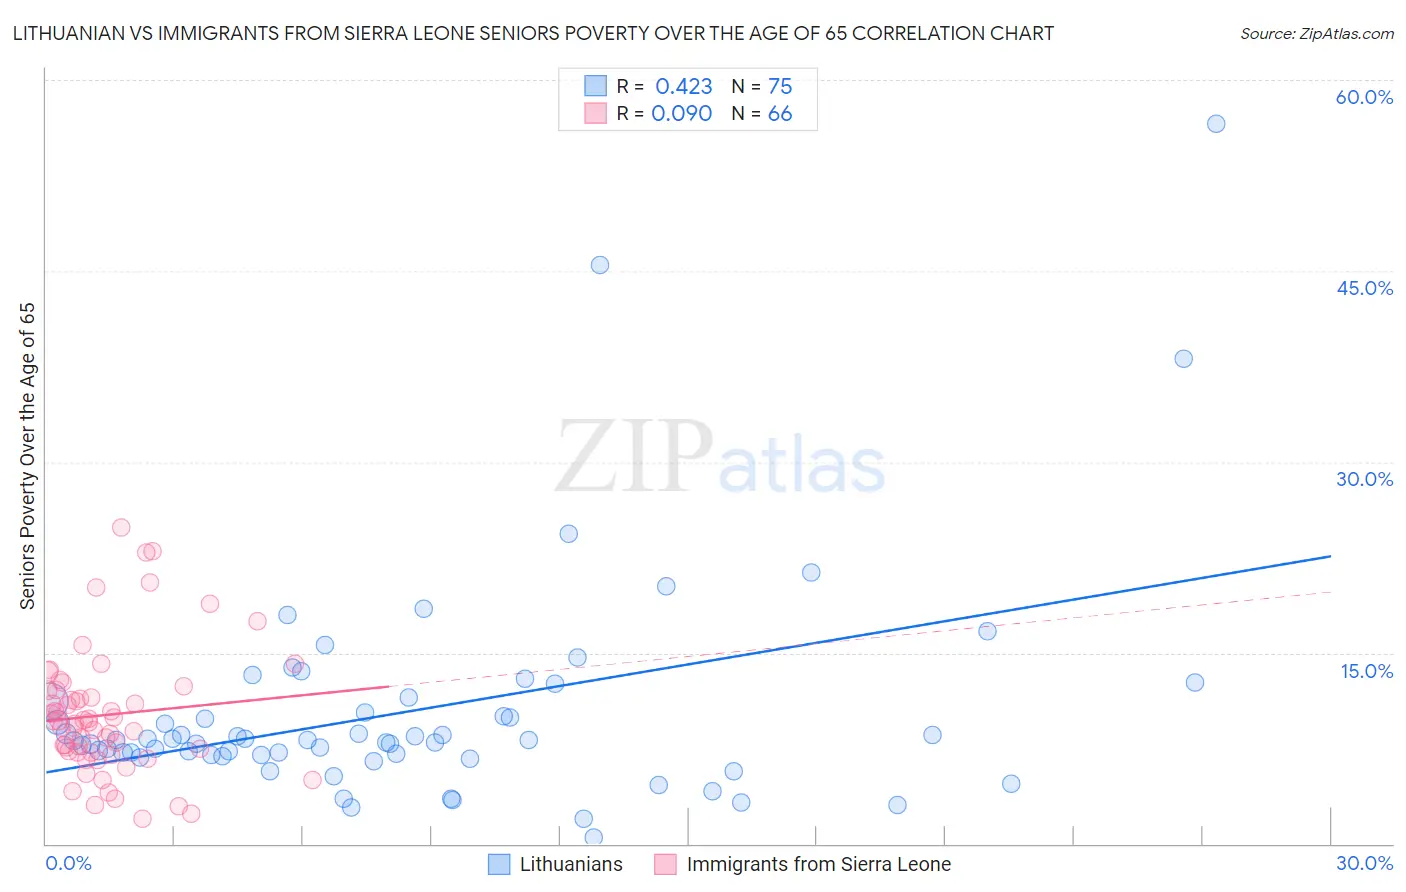
Lithuanian vs Immigrants from Sierra Leone Seniors Poverty Over the Age of 65 Correlation Chart
The statistical analysis conducted on geographies consisting of 420,213,281 people shows a moderate positive correlation between the proportion of Lithuanians and poverty level among seniors over the age of 65 in the United States with a correlation coefficient (R) of 0.423 and weighted average of 9.1%. Similarly, the statistical analysis conducted on geographies consisting of 101,564,098 people shows a slight positive correlation between the proportion of Immigrants from Sierra Leone and poverty level among seniors over the age of 65 in the United States with a correlation coefficient (R) of 0.090 and weighted average of 10.7%, a difference of 18.1%.
Seniors Poverty Over the Age of 65 Correlation Summary
| Measurement | Lithuanian | Immigrants from Sierra Leone |
| Minimum | 0.44% | 1.9% |
| Maximum | 56.6% | 24.8% |
| Range | 56.1% | 22.9% |
| Mean | 10.4% | 10.1% |
| Median | 8.1% | 9.6% |
| Interquartile 25% (IQ1) | 6.9% | 7.2% |
| Interquartile 75% (IQ3) | 11.2% | 12.0% |
| Interquartile Range (IQR) | 4.2% | 4.8% |
| Standard Deviation (Sample) | 8.8% | 4.9% |
| Standard Deviation (Population) | 8.7% | 4.9% |
Similar Demographics by Seniors Poverty Over the Age of 65
Demographics Similar to Lithuanians by Seniors Poverty Over the Age of 65
In terms of seniors poverty over the age of 65, the demographic groups most similar to Lithuanians are English (9.1%, a difference of 0.10%), Maltese (9.1%, a difference of 0.43%), Scandinavian (9.1%, a difference of 0.61%), Croatian (9.1%, a difference of 0.65%), and Polish (9.1%, a difference of 0.68%).
| Demographics | Rating | Rank | Seniors Poverty Over the Age of 65 |
| Norwegians | 100.0 /100 | #3 | Exceptional 8.7% |
| Swedes | 100.0 /100 | #4 | Exceptional 8.7% |
| Immigrants | India | 100.0 /100 | #5 | Exceptional 8.8% |
| Danes | 100.0 /100 | #6 | Exceptional 8.8% |
| Germans | 100.0 /100 | #7 | Exceptional 9.0% |
| Czechs | 100.0 /100 | #8 | Exceptional 9.0% |
| English | 100.0 /100 | #9 | Exceptional 9.1% |
| Lithuanians | 100.0 /100 | #10 | Exceptional 9.1% |
| Maltese | 99.9 /100 | #11 | Exceptional 9.1% |
| Scandinavians | 99.9 /100 | #12 | Exceptional 9.1% |
| Croatians | 99.9 /100 | #13 | Exceptional 9.1% |
| Poles | 99.9 /100 | #14 | Exceptional 9.1% |
| Dutch | 99.9 /100 | #15 | Exceptional 9.1% |
| Europeans | 99.9 /100 | #16 | Exceptional 9.2% |
| Scottish | 99.9 /100 | #17 | Exceptional 9.2% |
Demographics Similar to Immigrants from Sierra Leone by Seniors Poverty Over the Age of 65
In terms of seniors poverty over the age of 65, the demographic groups most similar to Immigrants from Sierra Leone are Immigrants from Micronesia (10.7%, a difference of 0.10%), Immigrants from Ethiopia (10.7%, a difference of 0.14%), Ethiopian (10.7%, a difference of 0.15%), Chickasaw (10.7%, a difference of 0.22%), and Sudanese (10.7%, a difference of 0.37%).
| Demographics | Rating | Rank | Seniors Poverty Over the Age of 65 |
| Spanish | 76.8 /100 | #151 | Good 10.6% |
| Immigrants | Egypt | 76.5 /100 | #152 | Good 10.6% |
| Fijians | 75.6 /100 | #153 | Good 10.7% |
| Immigrants | Saudi Arabia | 74.9 /100 | #154 | Good 10.7% |
| Chickasaw | 73.6 /100 | #155 | Good 10.7% |
| Ethiopians | 72.9 /100 | #156 | Good 10.7% |
| Immigrants | Ethiopia | 72.9 /100 | #157 | Good 10.7% |
| Immigrants | Sierra Leone | 71.7 /100 | #158 | Good 10.7% |
| Immigrants | Micronesia | 70.8 /100 | #159 | Good 10.7% |
| Sudanese | 68.2 /100 | #160 | Good 10.7% |
| Arabs | 65.2 /100 | #161 | Good 10.8% |
| Immigrants | Indonesia | 64.8 /100 | #162 | Good 10.8% |
| Tsimshian | 64.5 /100 | #163 | Good 10.8% |
| Potawatomi | 62.6 /100 | #164 | Good 10.8% |
| Immigrants | South Eastern Asia | 62.1 /100 | #165 | Good 10.8% |