Lithuanian vs Immigrants Unemployment
COMPARE
Lithuanian
Immigrants
Unemployment
Unemployment Comparison
Lithuanians
Immigrants
4.8%
UNEMPLOYMENT
99.7/ 100
METRIC RATING
39th/ 347
METRIC RANK
5.5%
UNEMPLOYMENT
2.6/ 100
METRIC RATING
239th/ 347
METRIC RANK
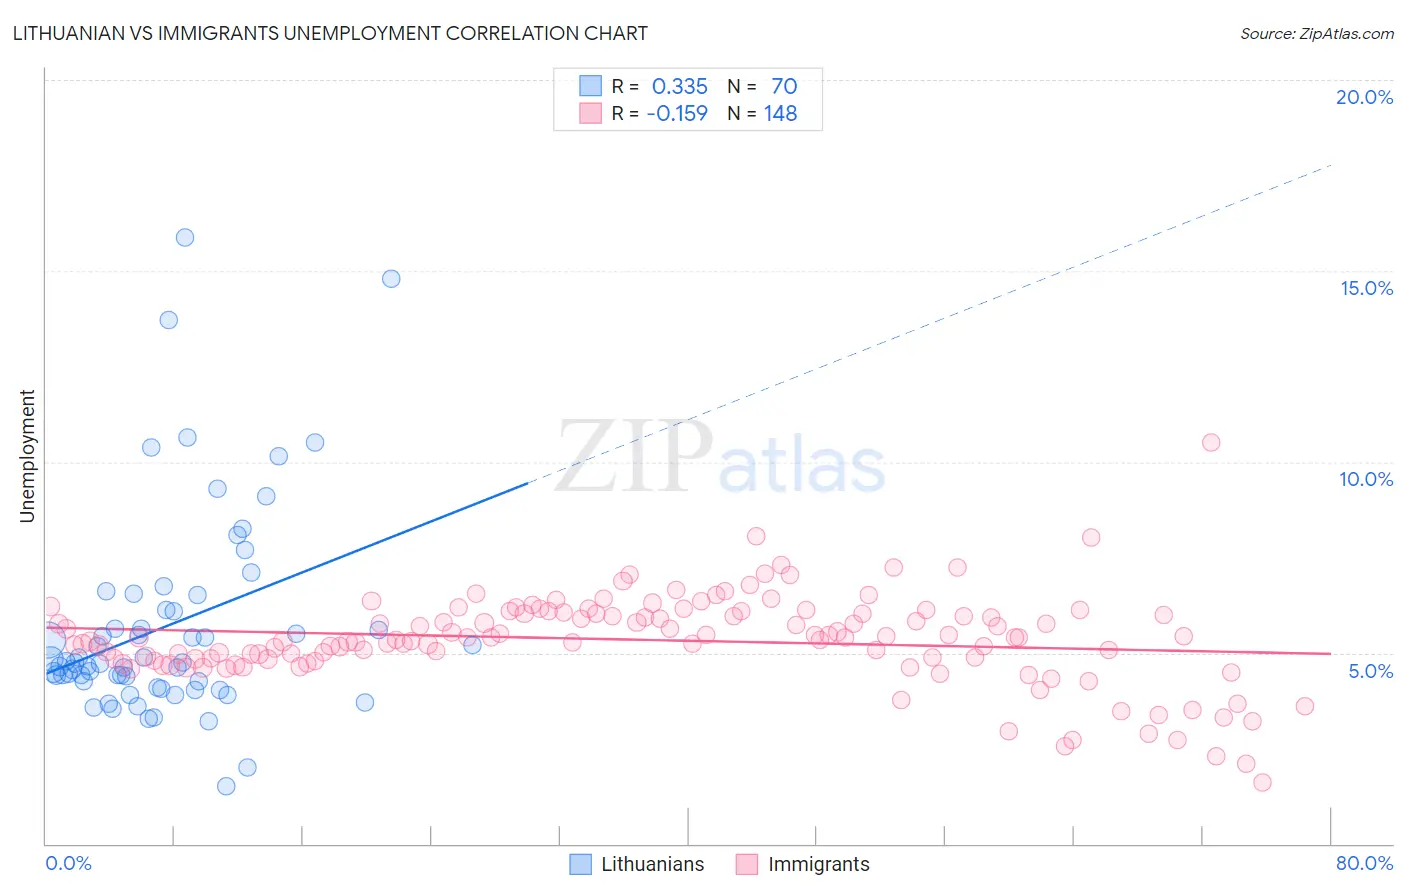
Lithuanian vs Immigrants Unemployment Correlation Chart
The statistical analysis conducted on geographies consisting of 421,273,270 people shows a mild positive correlation between the proportion of Lithuanians and unemployment in the United States with a correlation coefficient (R) of 0.335 and weighted average of 4.8%. Similarly, the statistical analysis conducted on geographies consisting of 573,511,766 people shows a poor negative correlation between the proportion of Immigrants and unemployment in the United States with a correlation coefficient (R) of -0.159 and weighted average of 5.5%, a difference of 15.7%.
Unemployment Correlation Summary
| Measurement | Lithuanian | Immigrants |
| Minimum | 1.5% | 1.6% |
| Maximum | 15.9% | 10.5% |
| Range | 14.4% | 8.9% |
| Mean | 5.7% | 5.3% |
| Median | 4.7% | 5.4% |
| Interquartile 25% (IQ1) | 4.3% | 4.8% |
| Interquartile 75% (IQ3) | 6.1% | 6.0% |
| Interquartile Range (IQR) | 1.9% | 1.2% |
| Standard Deviation (Sample) | 2.7% | 1.2% |
| Standard Deviation (Population) | 2.7% | 1.2% |
Similar Demographics by Unemployment
Demographics Similar to Lithuanians by Unemployment
In terms of unemployment, the demographic groups most similar to Lithuanians are Northern European (4.8%, a difference of 0.020%), Immigrants from Bosnia and Herzegovina (4.8%, a difference of 0.040%), Bolivian (4.8%, a difference of 0.14%), Czechoslovakian (4.8%, a difference of 0.34%), and Tongan (4.8%, a difference of 0.41%).
| Demographics | Rating | Rank | Unemployment |
| Zimbabweans | 99.8 /100 | #32 | Exceptional 4.8% |
| Sudanese | 99.8 /100 | #33 | Exceptional 4.8% |
| Immigrants | Bolivia | 99.8 /100 | #34 | Exceptional 4.8% |
| Scotch-Irish | 99.8 /100 | #35 | Exceptional 4.8% |
| Tongans | 99.7 /100 | #36 | Exceptional 4.8% |
| Czechoslovakians | 99.7 /100 | #37 | Exceptional 4.8% |
| Bolivians | 99.7 /100 | #38 | Exceptional 4.8% |
| Lithuanians | 99.7 /100 | #39 | Exceptional 4.8% |
| Northern Europeans | 99.7 /100 | #40 | Exceptional 4.8% |
| Immigrants | Bosnia and Herzegovina | 99.7 /100 | #41 | Exceptional 4.8% |
| Filipinos | 99.5 /100 | #42 | Exceptional 4.8% |
| Yugoslavians | 99.5 /100 | #43 | Exceptional 4.8% |
| Austrians | 99.5 /100 | #44 | Exceptional 4.8% |
| French | 99.5 /100 | #45 | Exceptional 4.8% |
| Immigrants | Nepal | 99.4 /100 | #46 | Exceptional 4.8% |
Demographics Similar to Immigrants by Unemployment
In terms of unemployment, the demographic groups most similar to Immigrants are Cree (5.6%, a difference of 0.010%), Immigrants from Western Asia (5.5%, a difference of 0.090%), Moroccan (5.5%, a difference of 0.29%), Tlingit-Haida (5.6%, a difference of 0.35%), and Immigrants from Cambodia (5.5%, a difference of 0.36%).
| Demographics | Rating | Rank | Unemployment |
| Comanche | 4.9 /100 | #232 | Tragic 5.5% |
| Immigrants | Syria | 4.8 /100 | #233 | Tragic 5.5% |
| Panamanians | 4.7 /100 | #234 | Tragic 5.5% |
| Immigrants | Panama | 3.4 /100 | #235 | Tragic 5.5% |
| Immigrants | Cambodia | 3.3 /100 | #236 | Tragic 5.5% |
| Moroccans | 3.2 /100 | #237 | Tragic 5.5% |
| Immigrants | Western Asia | 2.8 /100 | #238 | Tragic 5.5% |
| Immigrants | Immigrants | 2.6 /100 | #239 | Tragic 5.5% |
| Cree | 2.6 /100 | #240 | Tragic 5.6% |
| Tlingit-Haida | 2.0 /100 | #241 | Tragic 5.6% |
| Spanish Americans | 2.0 /100 | #242 | Tragic 5.6% |
| Marshallese | 1.3 /100 | #243 | Tragic 5.6% |
| Dutch West Indians | 1.2 /100 | #244 | Tragic 5.6% |
| French American Indians | 1.2 /100 | #245 | Tragic 5.6% |
| Bermudans | 1.1 /100 | #246 | Tragic 5.6% |