Lithuanian vs Immigrants from Jordan Male Unemployment
COMPARE
Lithuanian
Immigrants from Jordan
Male Unemployment
Male Unemployment Comparison
Lithuanians
Immigrants from Jordan
5.0%
MALE UNEMPLOYMENT
98.5/ 100
METRIC RATING
58th/ 347
METRIC RANK
5.1%
MALE UNEMPLOYMENT
91.9/ 100
METRIC RATING
103rd/ 347
METRIC RANK
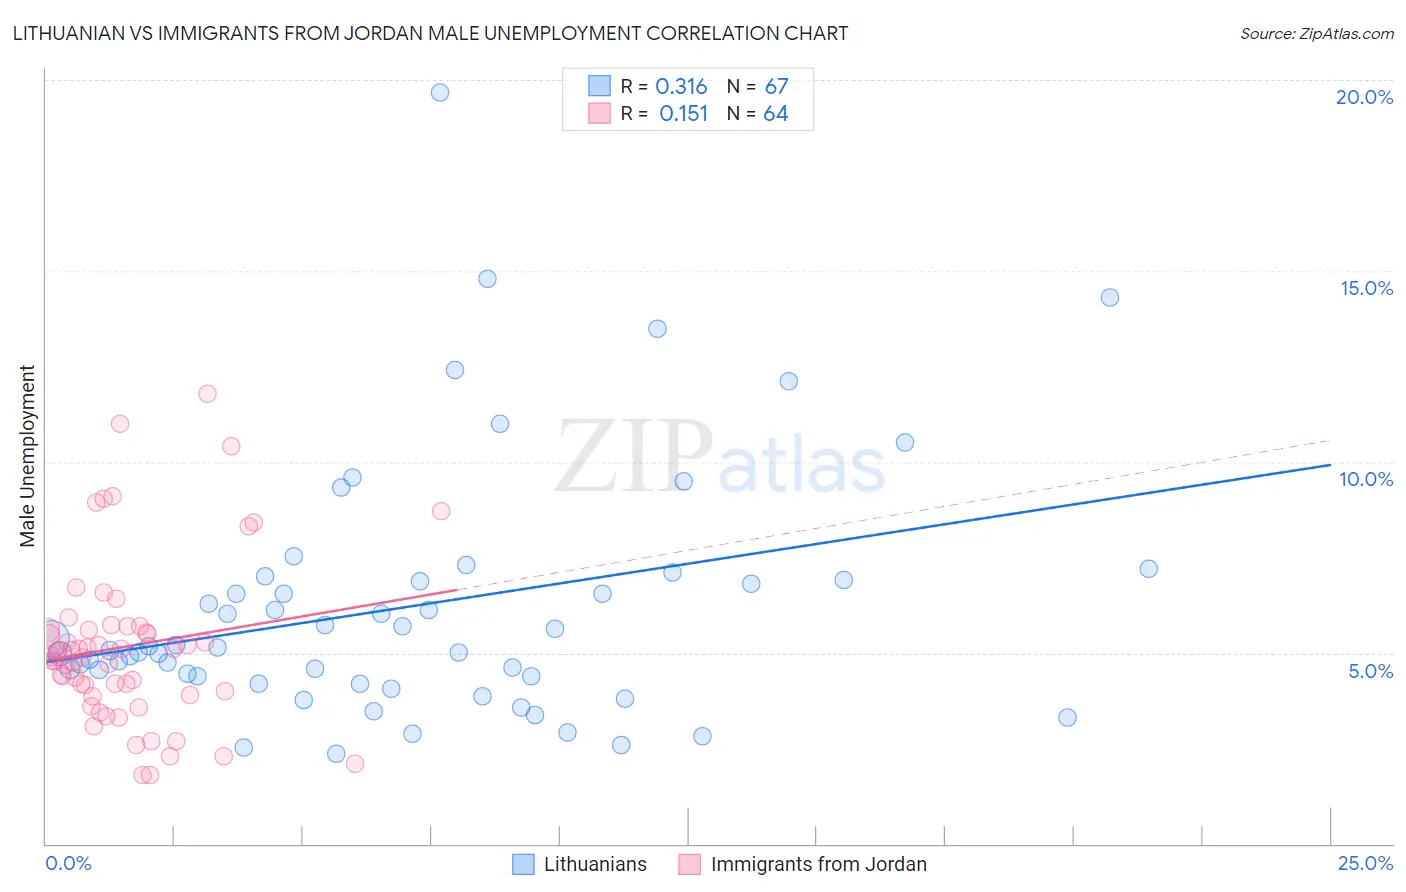
Lithuanian vs Immigrants from Jordan Male Unemployment Correlation Chart
The statistical analysis conducted on geographies consisting of 419,508,193 people shows a mild positive correlation between the proportion of Lithuanians and unemployment rate among males in the United States with a correlation coefficient (R) of 0.316 and weighted average of 5.0%. Similarly, the statistical analysis conducted on geographies consisting of 181,155,551 people shows a poor positive correlation between the proportion of Immigrants from Jordan and unemployment rate among males in the United States with a correlation coefficient (R) of 0.151 and weighted average of 5.1%, a difference of 2.7%.
Male Unemployment Correlation Summary
| Measurement | Lithuanian | Immigrants from Jordan |
| Minimum | 2.4% | 1.8% |
| Maximum | 19.7% | 11.8% |
| Range | 17.3% | 10.0% |
| Mean | 6.2% | 5.2% |
| Median | 5.2% | 5.0% |
| Interquartile 25% (IQ1) | 4.4% | 4.0% |
| Interquartile 75% (IQ3) | 6.9% | 5.6% |
| Interquartile Range (IQR) | 2.5% | 1.7% |
| Standard Deviation (Sample) | 3.3% | 2.1% |
| Standard Deviation (Population) | 3.2% | 2.1% |
Similar Demographics by Male Unemployment
Demographics Similar to Lithuanians by Male Unemployment
In terms of male unemployment, the demographic groups most similar to Lithuanians are Turkish (5.0%, a difference of 0.0%), Immigrants from Netherlands (5.0%, a difference of 0.14%), Immigrants from Bulgaria (5.0%, a difference of 0.23%), Yugoslavian (5.0%, a difference of 0.24%), and Czechoslovakian (5.0%, a difference of 0.24%).
| Demographics | Rating | Rank | Male Unemployment |
| Slovenes | 98.8 /100 | #51 | Exceptional 5.0% |
| Irish | 98.8 /100 | #52 | Exceptional 5.0% |
| Jordanians | 98.8 /100 | #53 | Exceptional 5.0% |
| Yugoslavians | 98.7 /100 | #54 | Exceptional 5.0% |
| Czechoslovakians | 98.7 /100 | #55 | Exceptional 5.0% |
| Immigrants | Bulgaria | 98.7 /100 | #56 | Exceptional 5.0% |
| Turks | 98.5 /100 | #57 | Exceptional 5.0% |
| Lithuanians | 98.5 /100 | #58 | Exceptional 5.0% |
| Immigrants | Netherlands | 98.3 /100 | #59 | Exceptional 5.0% |
| Immigrants | Argentina | 98.1 /100 | #60 | Exceptional 5.0% |
| Cambodians | 98.1 /100 | #61 | Exceptional 5.0% |
| Basques | 97.9 /100 | #62 | Exceptional 5.0% |
| Eastern Europeans | 97.9 /100 | #63 | Exceptional 5.0% |
| Celtics | 97.8 /100 | #64 | Exceptional 5.0% |
| Icelanders | 97.6 /100 | #65 | Exceptional 5.0% |
Demographics Similar to Immigrants from Jordan by Male Unemployment
In terms of male unemployment, the demographic groups most similar to Immigrants from Jordan are Immigrants from Chile (5.1%, a difference of 0.030%), Immigrants from Czechoslovakia (5.1%, a difference of 0.040%), Immigrants from Ethiopia (5.1%, a difference of 0.080%), Ethiopian (5.1%, a difference of 0.12%), and Immigrants from Nicaragua (5.1%, a difference of 0.13%).
| Demographics | Rating | Rank | Male Unemployment |
| Asians | 93.7 /100 | #96 | Exceptional 5.1% |
| Immigrants | Spain | 93.4 /100 | #97 | Exceptional 5.1% |
| Immigrants | Kuwait | 93.3 /100 | #98 | Exceptional 5.1% |
| Uruguayans | 93.0 /100 | #99 | Exceptional 5.1% |
| Russians | 92.9 /100 | #100 | Exceptional 5.1% |
| German Russians | 92.7 /100 | #101 | Exceptional 5.1% |
| Immigrants | France | 92.7 /100 | #102 | Exceptional 5.1% |
| Immigrants | Jordan | 91.9 /100 | #103 | Exceptional 5.1% |
| Immigrants | Chile | 91.8 /100 | #104 | Exceptional 5.1% |
| Immigrants | Czechoslovakia | 91.7 /100 | #105 | Exceptional 5.1% |
| Immigrants | Ethiopia | 91.5 /100 | #106 | Exceptional 5.1% |
| Ethiopians | 91.3 /100 | #107 | Exceptional 5.1% |
| Immigrants | Nicaragua | 91.2 /100 | #108 | Exceptional 5.1% |
| Immigrants | Pakistan | 90.9 /100 | #109 | Exceptional 5.1% |
| Immigrants | England | 90.8 /100 | #110 | Exceptional 5.1% |