Pennsylvania German vs Immigrants from Israel Unemployment Among Youth under 25 years
COMPARE
Pennsylvania German
Immigrants from Israel
Unemployment Among Youth under 25 years
Unemployment Among Youth under 25 years Comparison
Pennsylvania Germans
Immigrants from Israel
10.6%
UNEMPLOYMENT AMONG YOUTH UNDER 25 YEARS
100.0/ 100
METRIC RATING
21st/ 347
METRIC RANK
12.0%
UNEMPLOYMENT AMONG YOUTH UNDER 25 YEARS
2.6/ 100
METRIC RATING
226th/ 347
METRIC RANK
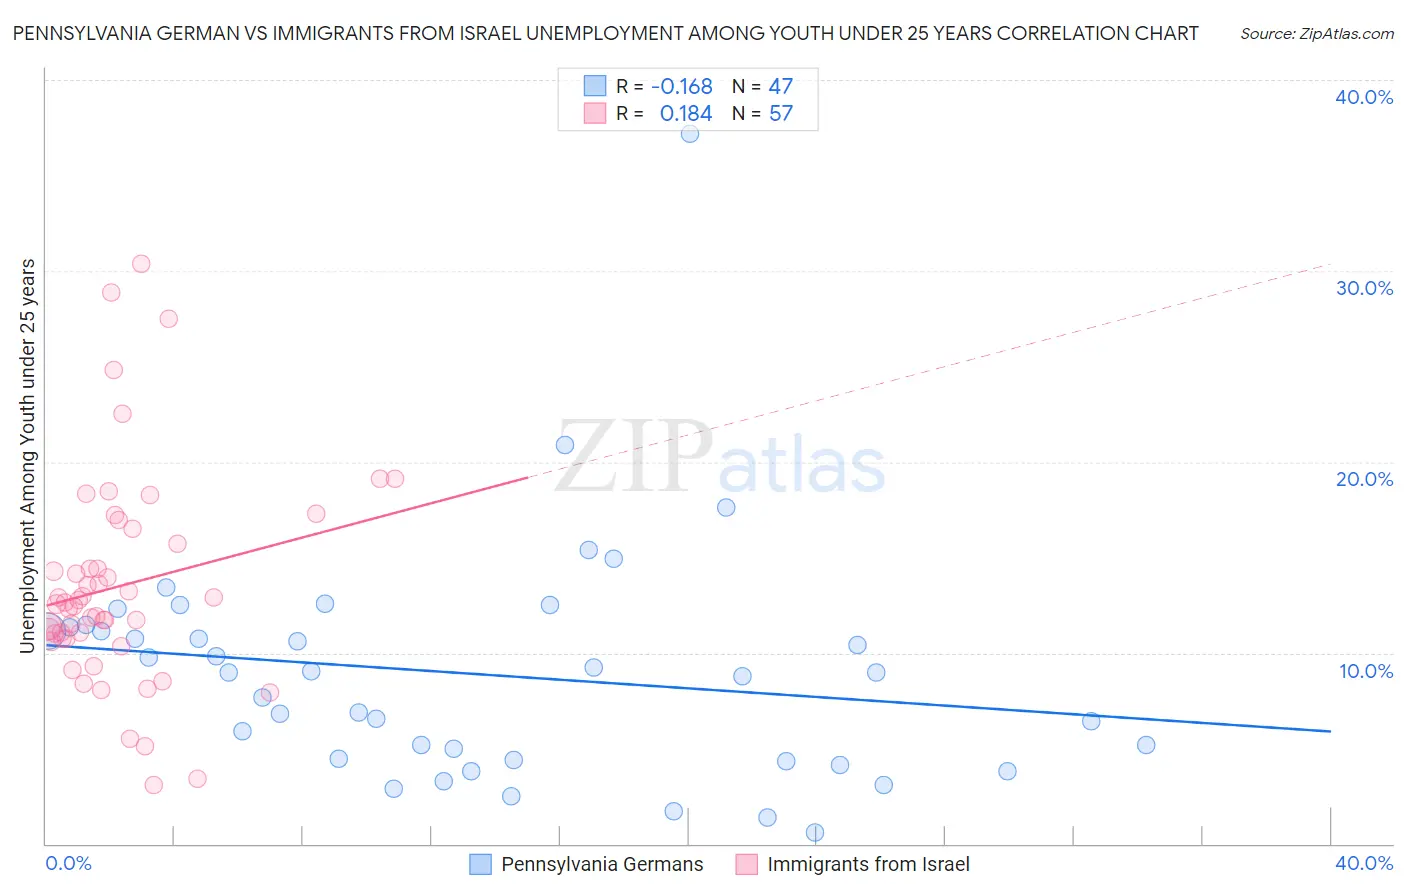
Pennsylvania German vs Immigrants from Israel Unemployment Among Youth under 25 years Correlation Chart
The statistical analysis conducted on geographies consisting of 230,294,303 people shows a poor negative correlation between the proportion of Pennsylvania Germans and unemployment rate among youth under the age of 25 in the United States with a correlation coefficient (R) of -0.168 and weighted average of 10.6%. Similarly, the statistical analysis conducted on geographies consisting of 208,849,337 people shows a poor positive correlation between the proportion of Immigrants from Israel and unemployment rate among youth under the age of 25 in the United States with a correlation coefficient (R) of 0.184 and weighted average of 12.0%, a difference of 13.3%.
Unemployment Among Youth under 25 years Correlation Summary
| Measurement | Pennsylvania German | Immigrants from Israel |
| Minimum | 0.60% | 3.1% |
| Maximum | 37.2% | 30.4% |
| Range | 36.6% | 27.3% |
| Mean | 8.9% | 13.5% |
| Median | 9.0% | 12.6% |
| Interquartile 25% (IQ1) | 4.4% | 10.7% |
| Interquartile 75% (IQ3) | 11.3% | 16.1% |
| Interquartile Range (IQR) | 6.9% | 5.3% |
| Standard Deviation (Sample) | 6.1% | 5.6% |
| Standard Deviation (Population) | 6.1% | 5.5% |
Similar Demographics by Unemployment Among Youth under 25 years
Demographics Similar to Pennsylvania Germans by Unemployment Among Youth under 25 years
In terms of unemployment among youth under 25 years, the demographic groups most similar to Pennsylvania Germans are Belgian (10.6%, a difference of 0.010%), Immigrants from Bosnia and Herzegovina (10.6%, a difference of 0.070%), Dutch (10.6%, a difference of 0.21%), Immigrants from Burma/Myanmar (10.6%, a difference of 0.23%), and Swiss (10.6%, a difference of 0.25%).
| Demographics | Rating | Rank | Unemployment Among Youth under 25 years |
| Cubans | 100.0 /100 | #14 | Exceptional 10.6% |
| Sudanese | 100.0 /100 | #15 | Exceptional 10.6% |
| Venezuelans | 100.0 /100 | #16 | Exceptional 10.6% |
| Menominee | 100.0 /100 | #17 | Exceptional 10.6% |
| Swiss | 100.0 /100 | #18 | Exceptional 10.6% |
| Immigrants | Burma/Myanmar | 100.0 /100 | #19 | Exceptional 10.6% |
| Dutch | 100.0 /100 | #20 | Exceptional 10.6% |
| Pennsylvania Germans | 100.0 /100 | #21 | Exceptional 10.6% |
| Belgians | 100.0 /100 | #22 | Exceptional 10.6% |
| Immigrants | Bosnia and Herzegovina | 100.0 /100 | #23 | Exceptional 10.6% |
| Finns | 100.0 /100 | #24 | Exceptional 10.7% |
| Immigrants | North Macedonia | 100.0 /100 | #25 | Exceptional 10.7% |
| Immigrants | India | 100.0 /100 | #26 | Exceptional 10.7% |
| Yugoslavians | 100.0 /100 | #27 | Exceptional 10.7% |
| Somalis | 100.0 /100 | #28 | Exceptional 10.7% |
Demographics Similar to Immigrants from Israel by Unemployment Among Youth under 25 years
In terms of unemployment among youth under 25 years, the demographic groups most similar to Immigrants from Israel are Immigrants from Iran (12.0%, a difference of 0.020%), Immigrants from Ukraine (12.0%, a difference of 0.14%), Immigrants from Fiji (12.1%, a difference of 0.25%), Moroccan (12.1%, a difference of 0.26%), and Hawaiian (12.0%, a difference of 0.29%).
| Demographics | Rating | Rank | Unemployment Among Youth under 25 years |
| Immigrants | Nonimmigrants | 6.2 /100 | #219 | Tragic 11.9% |
| Alsatians | 6.1 /100 | #220 | Tragic 11.9% |
| Immigrants | Portugal | 4.9 /100 | #221 | Tragic 12.0% |
| Israelis | 4.1 /100 | #222 | Tragic 12.0% |
| Immigrants | Ireland | 3.5 /100 | #223 | Tragic 12.0% |
| Hawaiians | 3.5 /100 | #224 | Tragic 12.0% |
| Immigrants | Ukraine | 3.0 /100 | #225 | Tragic 12.0% |
| Immigrants | Israel | 2.6 /100 | #226 | Tragic 12.0% |
| Immigrants | Iran | 2.6 /100 | #227 | Tragic 12.0% |
| Immigrants | Fiji | 2.1 /100 | #228 | Tragic 12.1% |
| Moroccans | 2.1 /100 | #229 | Tragic 12.1% |
| Choctaw | 1.9 /100 | #230 | Tragic 12.1% |
| Immigrants | South America | 1.8 /100 | #231 | Tragic 12.1% |
| Immigrants | Belarus | 1.6 /100 | #232 | Tragic 12.1% |
| South American Indians | 1.6 /100 | #233 | Tragic 12.1% |