Liberian vs Hopi Unemployment Among Youth under 25 years
COMPARE
Liberian
Hopi
Unemployment Among Youth under 25 years
Unemployment Among Youth under 25 years Comparison
Liberians
Hopi
12.4%
UNEMPLOYMENT AMONG YOUTH UNDER 25 YEARS
0.2/ 100
METRIC RATING
256th/ 347
METRIC RANK
21.5%
UNEMPLOYMENT AMONG YOUTH UNDER 25 YEARS
0.0/ 100
METRIC RATING
345th/ 347
METRIC RANK
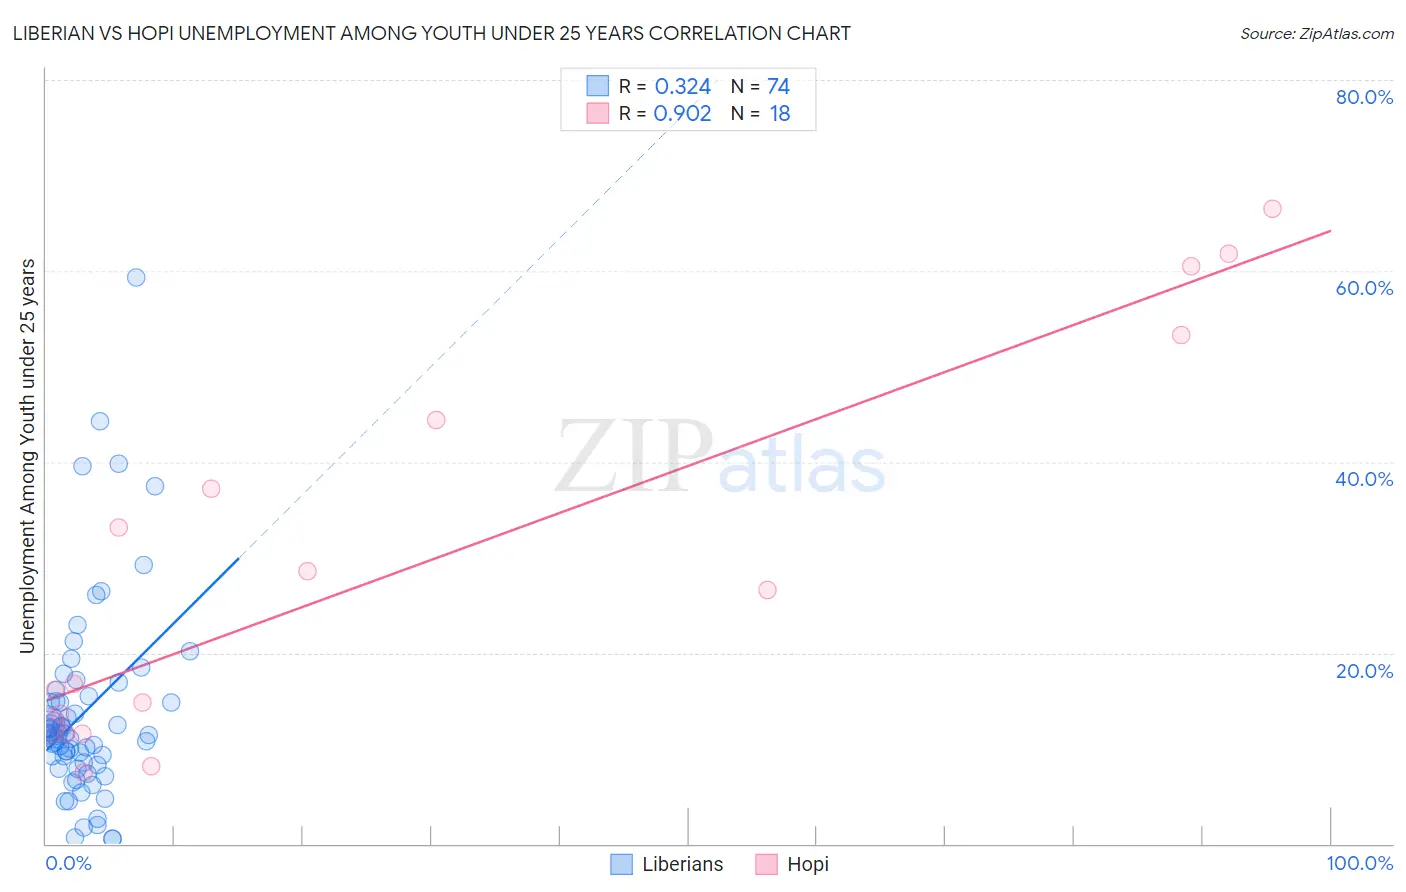
Liberian vs Hopi Unemployment Among Youth under 25 years Correlation Chart
The statistical analysis conducted on geographies consisting of 117,784,061 people shows a mild positive correlation between the proportion of Liberians and unemployment rate among youth under the age of 25 in the United States with a correlation coefficient (R) of 0.324 and weighted average of 12.4%. Similarly, the statistical analysis conducted on geographies consisting of 74,569,611 people shows a near-perfect positive correlation between the proportion of Hopi and unemployment rate among youth under the age of 25 in the United States with a correlation coefficient (R) of 0.902 and weighted average of 21.5%, a difference of 73.5%.
Unemployment Among Youth under 25 years Correlation Summary
| Measurement | Liberian | Hopi |
| Minimum | 0.50% | 7.5% |
| Maximum | 59.3% | 66.5% |
| Range | 58.8% | 59.0% |
| Mean | 13.6% | 29.1% |
| Median | 11.4% | 21.7% |
| Interquartile 25% (IQ1) | 8.5% | 12.3% |
| Interquartile 75% (IQ3) | 14.9% | 44.4% |
| Interquartile Range (IQR) | 6.4% | 32.1% |
| Standard Deviation (Sample) | 10.2% | 20.2% |
| Standard Deviation (Population) | 10.2% | 19.6% |
Similar Demographics by Unemployment Among Youth under 25 years
Demographics Similar to Liberians by Unemployment Among Youth under 25 years
In terms of unemployment among youth under 25 years, the demographic groups most similar to Liberians are Panamanian (12.4%, a difference of 0.010%), Salvadoran (12.4%, a difference of 0.040%), Hispanic or Latino (12.4%, a difference of 0.070%), Immigrants from Central America (12.4%, a difference of 0.10%), and Immigrants from Panama (12.4%, a difference of 0.39%).
| Demographics | Rating | Rank | Unemployment Among Youth under 25 years |
| Soviet Union | 0.6 /100 | #249 | Tragic 12.2% |
| Delaware | 0.4 /100 | #250 | Tragic 12.3% |
| Mexican American Indians | 0.4 /100 | #251 | Tragic 12.3% |
| Immigrants | Syria | 0.3 /100 | #252 | Tragic 12.3% |
| Mexicans | 0.3 /100 | #253 | Tragic 12.3% |
| Hondurans | 0.3 /100 | #254 | Tragic 12.3% |
| Hispanics or Latinos | 0.2 /100 | #255 | Tragic 12.4% |
| Liberians | 0.2 /100 | #256 | Tragic 12.4% |
| Panamanians | 0.2 /100 | #257 | Tragic 12.4% |
| Salvadorans | 0.1 /100 | #258 | Tragic 12.4% |
| Immigrants | Central America | 0.1 /100 | #259 | Tragic 12.4% |
| Immigrants | Panama | 0.1 /100 | #260 | Tragic 12.4% |
| Immigrants | El Salvador | 0.1 /100 | #261 | Tragic 12.4% |
| Immigrants | Mexico | 0.1 /100 | #262 | Tragic 12.4% |
| Cree | 0.1 /100 | #263 | Tragic 12.4% |
Demographics Similar to Hopi by Unemployment Among Youth under 25 years
In terms of unemployment among youth under 25 years, the demographic groups most similar to Hopi are Inupiat (22.0%, a difference of 2.5%), Crow (20.1%, a difference of 7.0%), Yup'ik (23.7%, a difference of 10.6%), Navajo (18.6%, a difference of 15.3%), and Puerto Rican (18.4%, a difference of 16.6%).
| Demographics | Rating | Rank | Unemployment Among Youth under 25 years |
| Guyanese | 0.0 /100 | #333 | Tragic 15.9% |
| Immigrants | Guyana | 0.0 /100 | #334 | Tragic 15.9% |
| Immigrants | St. Vincent and the Grenadines | 0.0 /100 | #335 | Tragic 16.1% |
| Pima | 0.0 /100 | #336 | Tragic 16.2% |
| Arapaho | 0.0 /100 | #337 | Tragic 16.3% |
| Yuman | 0.0 /100 | #338 | Tragic 16.3% |
| Tsimshian | 0.0 /100 | #339 | Tragic 16.5% |
| Colville | 0.0 /100 | #340 | Tragic 16.8% |
| Paiute | 0.0 /100 | #341 | Tragic 17.6% |
| Puerto Ricans | 0.0 /100 | #342 | Tragic 18.4% |
| Navajo | 0.0 /100 | #343 | Tragic 18.6% |
| Crow | 0.0 /100 | #344 | Tragic 20.1% |
| Hopi | 0.0 /100 | #345 | Tragic 21.5% |
| Inupiat | 0.0 /100 | #346 | Tragic 22.0% |
| Yup'ik | 0.0 /100 | #347 | Tragic 23.7% |