Liberian vs Honduran Unemployment Among Women with Children Under 6 years
COMPARE
Liberian
Honduran
Unemployment Among Women with Children Under 6 years
Unemployment Among Women with Children Under 6 years Comparison
Liberians
Hondurans
8.1%
UNEMPLOYMENT AMONG WOMEN WITH CHILDREN UNDER 6 YEARS
2.6/ 100
METRIC RATING
241st/ 347
METRIC RANK
8.4%
UNEMPLOYMENT AMONG WOMEN WITH CHILDREN UNDER 6 YEARS
0.3/ 100
METRIC RATING
264th/ 347
METRIC RANK
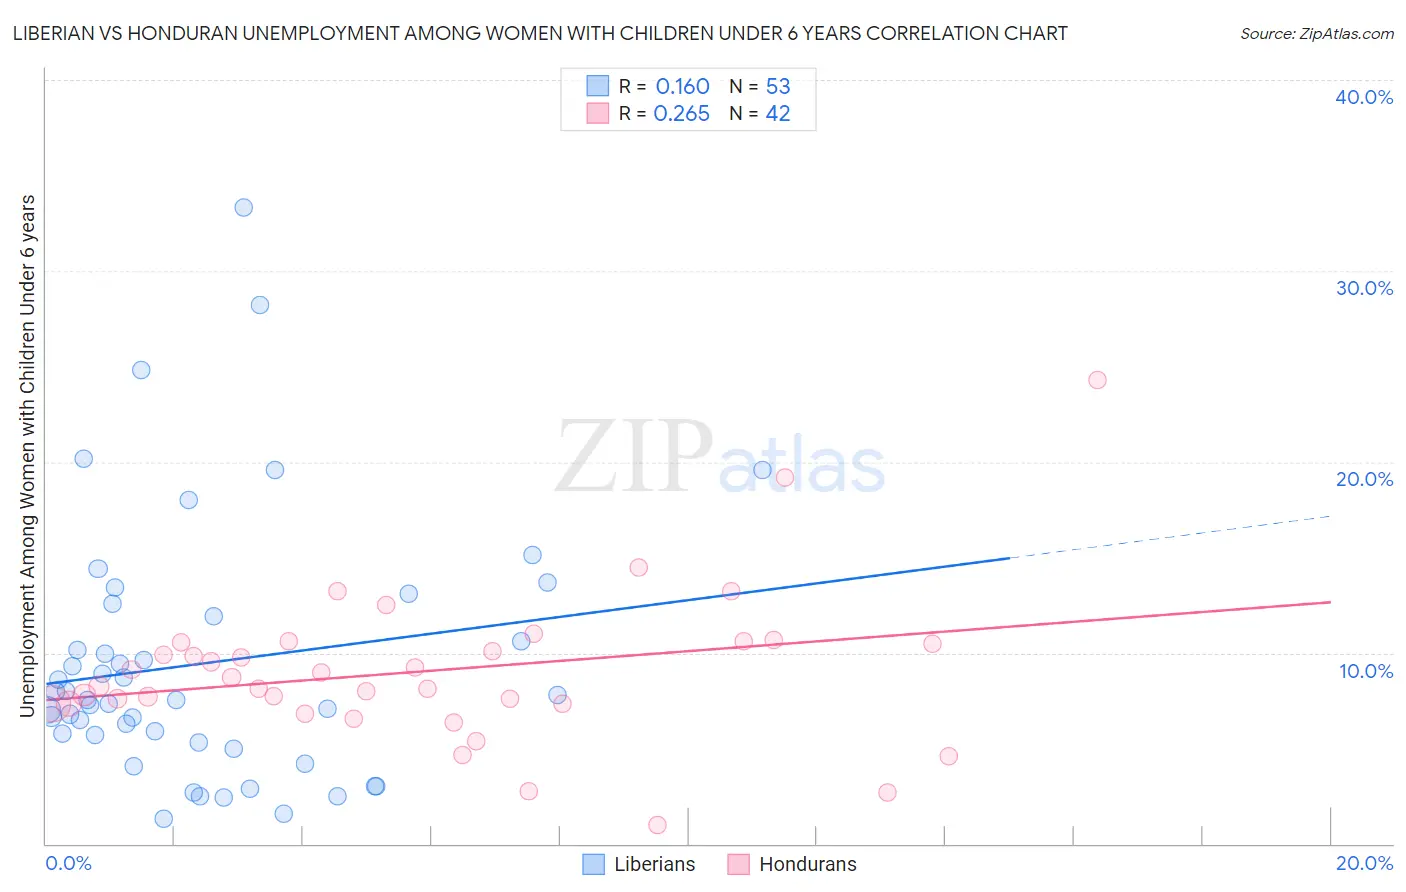
Liberian vs Honduran Unemployment Among Women with Children Under 6 years Correlation Chart
The statistical analysis conducted on geographies consisting of 106,761,438 people shows a poor positive correlation between the proportion of Liberians and unemployment rate among women with children under the age of 6 in the United States with a correlation coefficient (R) of 0.160 and weighted average of 8.1%. Similarly, the statistical analysis conducted on geographies consisting of 285,811,786 people shows a weak positive correlation between the proportion of Hondurans and unemployment rate among women with children under the age of 6 in the United States with a correlation coefficient (R) of 0.265 and weighted average of 8.4%, a difference of 3.5%.
Unemployment Among Women with Children Under 6 years Correlation Summary
| Measurement | Liberian | Honduran |
| Minimum | 1.3% | 1.0% |
| Maximum | 33.3% | 24.3% |
| Range | 32.0% | 23.3% |
| Mean | 9.5% | 9.0% |
| Median | 7.5% | 8.5% |
| Interquartile 25% (IQ1) | 5.5% | 7.3% |
| Interquartile 75% (IQ3) | 12.2% | 10.6% |
| Interquartile Range (IQR) | 6.7% | 3.2% |
| Standard Deviation (Sample) | 6.7% | 4.0% |
| Standard Deviation (Population) | 6.6% | 4.0% |
Similar Demographics by Unemployment Among Women with Children Under 6 years
Demographics Similar to Liberians by Unemployment Among Women with Children Under 6 years
In terms of unemployment among women with children under 6 years, the demographic groups most similar to Liberians are Immigrants from El Salvador (8.1%, a difference of 0.030%), Dutch (8.1%, a difference of 0.060%), Irish (8.1%, a difference of 0.10%), Immigrants from Middle Africa (8.1%, a difference of 0.36%), and Hawaiian (8.2%, a difference of 0.61%).
| Demographics | Rating | Rank | Unemployment Among Women with Children Under 6 years |
| Kiowa | 4.4 /100 | #234 | Tragic 8.0% |
| Comanche | 4.3 /100 | #235 | Tragic 8.0% |
| Immigrants | Barbados | 4.2 /100 | #236 | Tragic 8.0% |
| Immigrants | Costa Rica | 4.1 /100 | #237 | Tragic 8.0% |
| Immigrants | Middle Africa | 3.2 /100 | #238 | Tragic 8.1% |
| Irish | 2.7 /100 | #239 | Tragic 8.1% |
| Immigrants | El Salvador | 2.6 /100 | #240 | Tragic 8.1% |
| Liberians | 2.6 /100 | #241 | Tragic 8.1% |
| Dutch | 2.5 /100 | #242 | Tragic 8.1% |
| Hawaiians | 1.8 /100 | #243 | Tragic 8.2% |
| French | 1.7 /100 | #244 | Tragic 8.2% |
| Native Hawaiians | 1.7 /100 | #245 | Tragic 8.2% |
| Central Americans | 1.4 /100 | #246 | Tragic 8.2% |
| German Russians | 1.2 /100 | #247 | Tragic 8.2% |
| Immigrants | Western Africa | 1.1 /100 | #248 | Tragic 8.2% |
Demographics Similar to Hondurans by Unemployment Among Women with Children Under 6 years
In terms of unemployment among women with children under 6 years, the demographic groups most similar to Hondurans are Scotch-Irish (8.4%, a difference of 0.020%), West Indian (8.4%, a difference of 0.050%), French Canadian (8.4%, a difference of 0.050%), Immigrants from Honduras (8.4%, a difference of 0.050%), and Immigrants from Liberia (8.4%, a difference of 0.060%).
| Demographics | Rating | Rank | Unemployment Among Women with Children Under 6 years |
| British West Indians | 0.5 /100 | #257 | Tragic 8.3% |
| Immigrants | Ghana | 0.5 /100 | #258 | Tragic 8.3% |
| Barbadians | 0.4 /100 | #259 | Tragic 8.3% |
| Whites/Caucasians | 0.3 /100 | #260 | Tragic 8.4% |
| Immigrants | Liberia | 0.3 /100 | #261 | Tragic 8.4% |
| West Indians | 0.3 /100 | #262 | Tragic 8.4% |
| Scotch-Irish | 0.3 /100 | #263 | Tragic 8.4% |
| Hondurans | 0.3 /100 | #264 | Tragic 8.4% |
| French Canadians | 0.3 /100 | #265 | Tragic 8.4% |
| Immigrants | Honduras | 0.3 /100 | #266 | Tragic 8.4% |
| Belizeans | 0.2 /100 | #267 | Tragic 8.4% |
| Sub-Saharan Africans | 0.2 /100 | #268 | Tragic 8.4% |
| Immigrants | Haiti | 0.2 /100 | #269 | Tragic 8.4% |
| Immigrants | Senegal | 0.2 /100 | #270 | Tragic 8.5% |
| Immigrants | Congo | 0.2 /100 | #271 | Tragic 8.5% |