Liberian vs Guamanian/Chamorro Unemployment Among Ages 65 to 74 years
COMPARE
Liberian
Guamanian/Chamorro
Unemployment Among Ages 65 to 74 years
Unemployment Among Ages 65 to 74 years Comparison
Liberians
Guamanians/Chamorros
5.8%
UNEMPLOYMENT AMONG AGES 65 TO 74 YEARS
0.0/ 100
METRIC RATING
302nd/ 347
METRIC RANK
5.4%
UNEMPLOYMENT AMONG AGES 65 TO 74 YEARS
42.1/ 100
METRIC RATING
179th/ 347
METRIC RANK
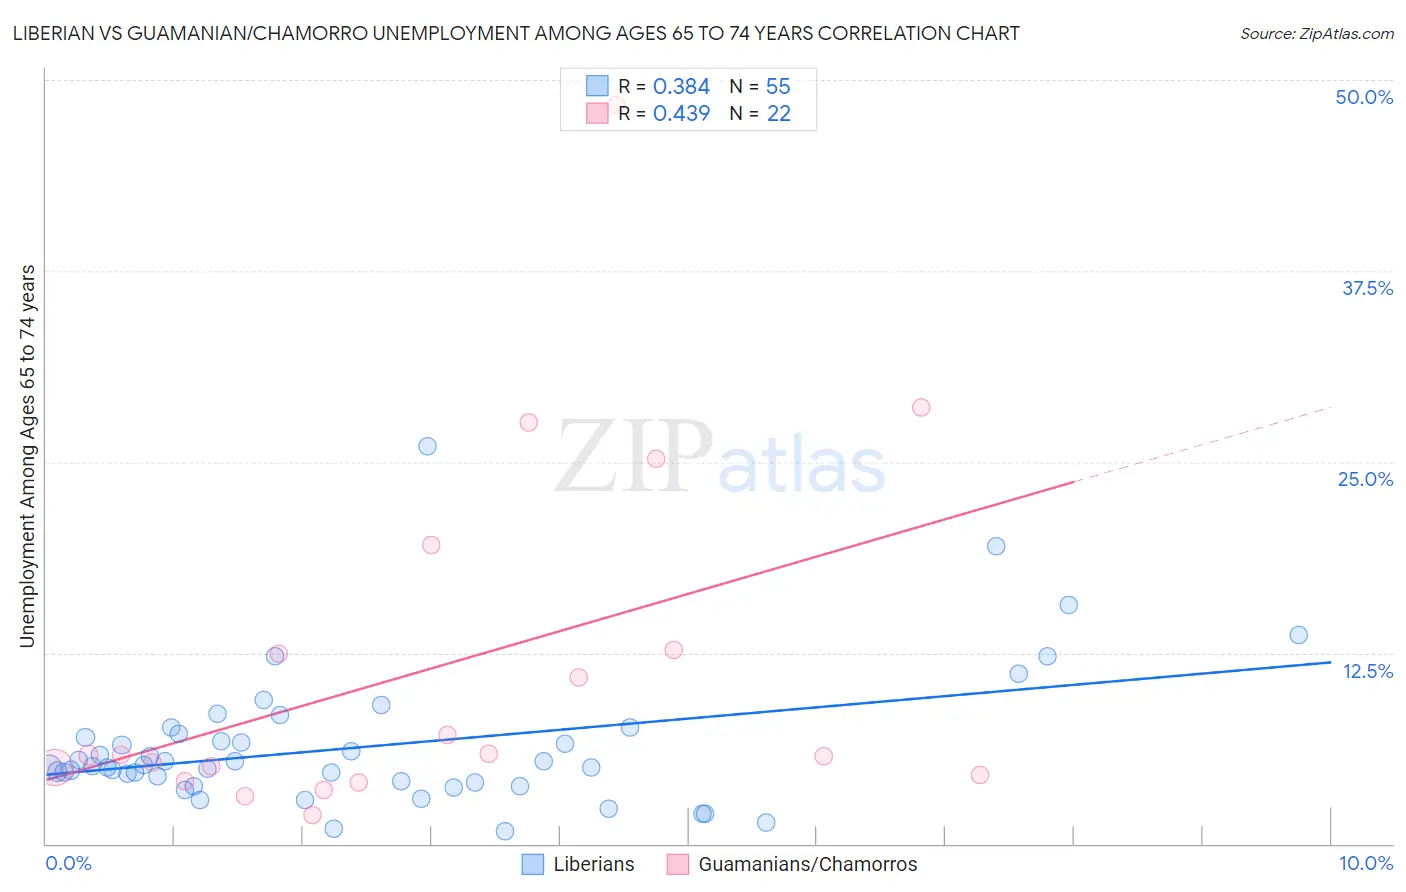
Liberian vs Guamanian/Chamorro Unemployment Among Ages 65 to 74 years Correlation Chart
The statistical analysis conducted on geographies consisting of 112,457,938 people shows a mild positive correlation between the proportion of Liberians and unemployment rate among population between the ages 65 and 74 in the United States with a correlation coefficient (R) of 0.384 and weighted average of 5.8%. Similarly, the statistical analysis conducted on geographies consisting of 205,325,278 people shows a moderate positive correlation between the proportion of Guamanians/Chamorros and unemployment rate among population between the ages 65 and 74 in the United States with a correlation coefficient (R) of 0.439 and weighted average of 5.4%, a difference of 8.4%.
Unemployment Among Ages 65 to 74 years Correlation Summary
| Measurement | Liberian | Guamanian/Chamorro |
| Minimum | 0.80% | 1.9% |
| Maximum | 26.0% | 48.4% |
| Range | 25.2% | 46.5% |
| Mean | 6.4% | 11.5% |
| Median | 5.1% | 5.8% |
| Interquartile 25% (IQ1) | 4.0% | 4.5% |
| Interquartile 75% (IQ3) | 7.2% | 12.7% |
| Interquartile Range (IQR) | 3.2% | 8.2% |
| Standard Deviation (Sample) | 4.5% | 11.6% |
| Standard Deviation (Population) | 4.4% | 11.3% |
Similar Demographics by Unemployment Among Ages 65 to 74 years
Demographics Similar to Liberians by Unemployment Among Ages 65 to 74 years
In terms of unemployment among ages 65 to 74 years, the demographic groups most similar to Liberians are Arapaho (5.8%, a difference of 0.020%), Salvadoran (5.8%, a difference of 0.030%), Mexican (5.8%, a difference of 0.040%), Cheyenne (5.8%, a difference of 0.040%), and British West Indian (5.8%, a difference of 0.050%).
| Demographics | Rating | Rank | Unemployment Among Ages 65 to 74 years |
| Blacks/African Americans | 0.0 /100 | #295 | Tragic 5.8% |
| Pennsylvania Germans | 0.0 /100 | #296 | Tragic 5.8% |
| Houma | 0.0 /100 | #297 | Tragic 5.8% |
| Immigrants | Latin America | 0.0 /100 | #298 | Tragic 5.8% |
| Barbadians | 0.0 /100 | #299 | Tragic 5.8% |
| Ecuadorians | 0.0 /100 | #300 | Tragic 5.8% |
| Armenians | 0.0 /100 | #301 | Tragic 5.8% |
| Liberians | 0.0 /100 | #302 | Tragic 5.8% |
| Arapaho | 0.0 /100 | #303 | Tragic 5.8% |
| Salvadorans | 0.0 /100 | #304 | Tragic 5.8% |
| Mexicans | 0.0 /100 | #305 | Tragic 5.8% |
| Cheyenne | 0.0 /100 | #306 | Tragic 5.8% |
| British West Indians | 0.0 /100 | #307 | Tragic 5.8% |
| Guatemalans | 0.0 /100 | #308 | Tragic 5.8% |
| Immigrants | Ecuador | 0.0 /100 | #309 | Tragic 5.8% |
Demographics Similar to Guamanians/Chamorros by Unemployment Among Ages 65 to 74 years
In terms of unemployment among ages 65 to 74 years, the demographic groups most similar to Guamanians/Chamorros are Immigrants from Ireland (5.4%, a difference of 0.0%), French (5.4%, a difference of 0.030%), Soviet Union (5.4%, a difference of 0.070%), Spanish American (5.4%, a difference of 0.14%), and Arab (5.4%, a difference of 0.16%).
| Demographics | Rating | Rank | Unemployment Among Ages 65 to 74 years |
| Greeks | 51.1 /100 | #172 | Average 5.4% |
| Immigrants | Northern Europe | 51.1 /100 | #173 | Average 5.4% |
| Potawatomi | 50.0 /100 | #174 | Average 5.4% |
| Immigrants | Iran | 49.0 /100 | #175 | Average 5.4% |
| Immigrants | Western Europe | 47.3 /100 | #176 | Average 5.4% |
| Arabs | 46.8 /100 | #177 | Average 5.4% |
| French | 43.1 /100 | #178 | Average 5.4% |
| Guamanians/Chamorros | 42.1 /100 | #179 | Average 5.4% |
| Immigrants | Ireland | 42.0 /100 | #180 | Average 5.4% |
| Soviet Union | 40.0 /100 | #181 | Fair 5.4% |
| Spanish Americans | 38.2 /100 | #182 | Fair 5.4% |
| Immigrants | Spain | 37.3 /100 | #183 | Fair 5.4% |
| Immigrants | Senegal | 35.2 /100 | #184 | Fair 5.4% |
| Russians | 34.4 /100 | #185 | Fair 5.4% |
| Lithuanians | 32.4 /100 | #186 | Fair 5.4% |