Soviet Union vs Cypriot Unemployment Among Ages 65 to 74 years
COMPARE
Soviet Union
Cypriot
Unemployment Among Ages 65 to 74 years
Unemployment Among Ages 65 to 74 years Comparison
Soviet Union
Cypriots
5.4%
UNEMPLOYMENT AMONG AGES 65 TO 74 YEARS
40.0/ 100
METRIC RATING
181st/ 347
METRIC RANK
5.7%
UNEMPLOYMENT AMONG AGES 65 TO 74 YEARS
0.1/ 100
METRIC RATING
283rd/ 347
METRIC RANK
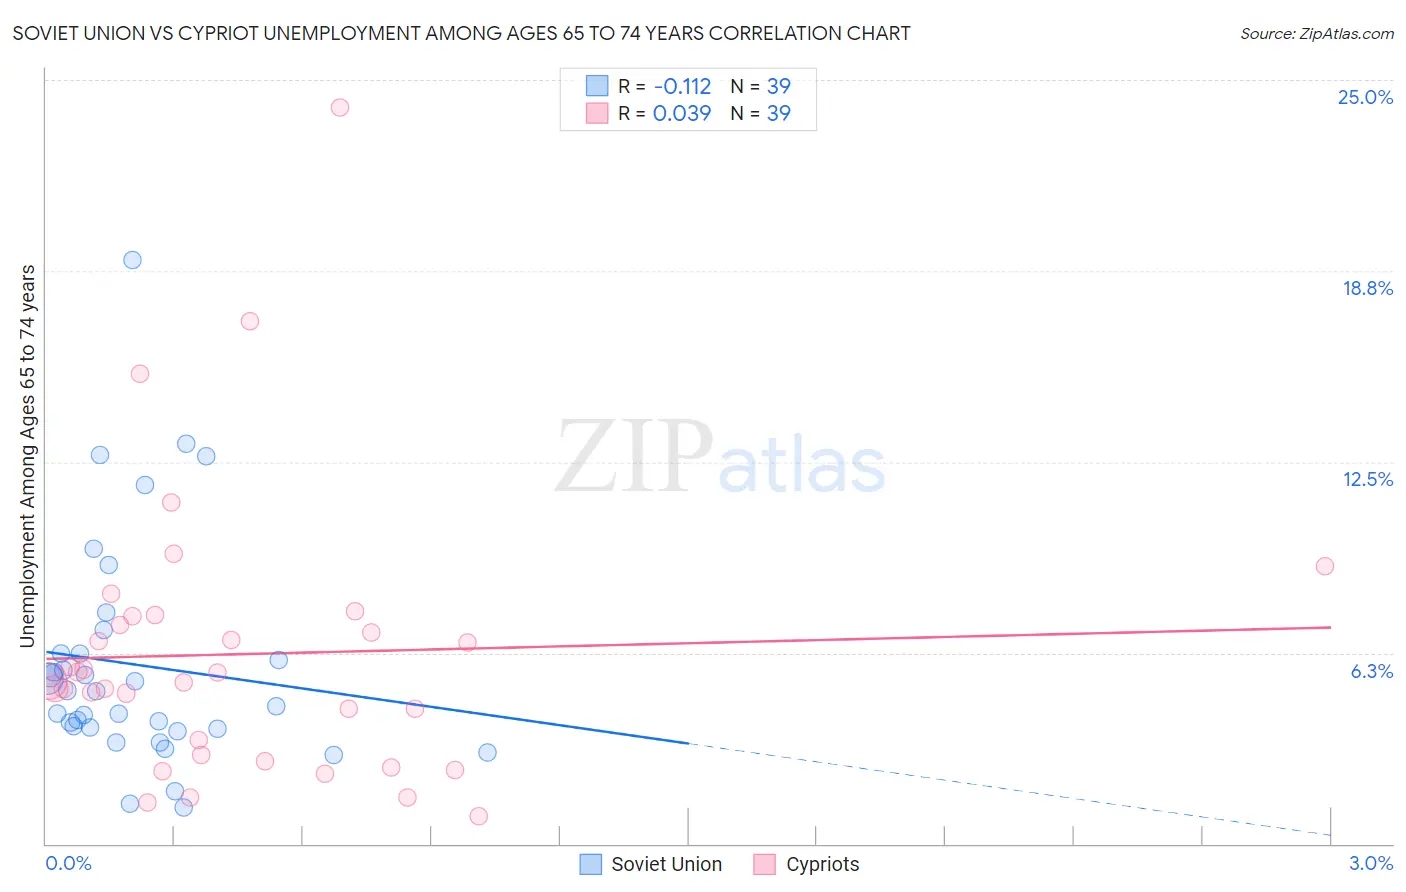
Soviet Union vs Cypriot Unemployment Among Ages 65 to 74 years Correlation Chart
The statistical analysis conducted on geographies consisting of 43,068,547 people shows a poor negative correlation between the proportion of Soviet Union and unemployment rate among population between the ages 65 and 74 in the United States with a correlation coefficient (R) of -0.112 and weighted average of 5.4%. Similarly, the statistical analysis conducted on geographies consisting of 60,122,993 people shows no correlation between the proportion of Cypriots and unemployment rate among population between the ages 65 and 74 in the United States with a correlation coefficient (R) of 0.039 and weighted average of 5.7%, a difference of 5.8%.
Unemployment Among Ages 65 to 74 years Correlation Summary
| Measurement | Soviet Union | Cypriot |
| Minimum | 1.2% | 0.90% |
| Maximum | 19.1% | 24.1% |
| Range | 17.9% | 23.2% |
| Mean | 5.9% | 6.2% |
| Median | 5.0% | 5.3% |
| Interquartile 25% (IQ1) | 3.8% | 2.9% |
| Interquartile 75% (IQ3) | 6.2% | 7.4% |
| Interquartile Range (IQR) | 2.5% | 4.5% |
| Standard Deviation (Sample) | 3.7% | 4.5% |
| Standard Deviation (Population) | 3.7% | 4.5% |
Similar Demographics by Unemployment Among Ages 65 to 74 years
Demographics Similar to Soviet Union by Unemployment Among Ages 65 to 74 years
In terms of unemployment among ages 65 to 74 years, the demographic groups most similar to Soviet Union are Spanish American (5.4%, a difference of 0.060%), Guamanian/Chamorro (5.4%, a difference of 0.070%), Immigrants from Ireland (5.4%, a difference of 0.070%), Immigrants from Spain (5.4%, a difference of 0.090%), and French (5.4%, a difference of 0.11%).
| Demographics | Rating | Rank | Unemployment Among Ages 65 to 74 years |
| Potawatomi | 50.0 /100 | #174 | Average 5.4% |
| Immigrants | Iran | 49.0 /100 | #175 | Average 5.4% |
| Immigrants | Western Europe | 47.3 /100 | #176 | Average 5.4% |
| Arabs | 46.8 /100 | #177 | Average 5.4% |
| French | 43.1 /100 | #178 | Average 5.4% |
| Guamanians/Chamorros | 42.1 /100 | #179 | Average 5.4% |
| Immigrants | Ireland | 42.0 /100 | #180 | Average 5.4% |
| Soviet Union | 40.0 /100 | #181 | Fair 5.4% |
| Spanish Americans | 38.2 /100 | #182 | Fair 5.4% |
| Immigrants | Spain | 37.3 /100 | #183 | Fair 5.4% |
| Immigrants | Senegal | 35.2 /100 | #184 | Fair 5.4% |
| Russians | 34.4 /100 | #185 | Fair 5.4% |
| Lithuanians | 32.4 /100 | #186 | Fair 5.4% |
| Immigrants | Nonimmigrants | 30.6 /100 | #187 | Fair 5.4% |
| Immigrants | Europe | 28.8 /100 | #188 | Fair 5.4% |
Demographics Similar to Cypriots by Unemployment Among Ages 65 to 74 years
In terms of unemployment among ages 65 to 74 years, the demographic groups most similar to Cypriots are Chippewa (5.7%, a difference of 0.010%), Ottawa (5.7%, a difference of 0.030%), Immigrants from Sierra Leone (5.7%, a difference of 0.060%), Immigrants from West Indies (5.7%, a difference of 0.080%), and Marshallese (5.7%, a difference of 0.090%).
| Demographics | Rating | Rank | Unemployment Among Ages 65 to 74 years |
| Somalis | 0.1 /100 | #276 | Tragic 5.7% |
| Immigrants | South America | 0.1 /100 | #277 | Tragic 5.7% |
| Mexican American Indians | 0.1 /100 | #278 | Tragic 5.7% |
| Immigrants | Norway | 0.1 /100 | #279 | Tragic 5.7% |
| Moroccans | 0.1 /100 | #280 | Tragic 5.7% |
| Immigrants | West Indies | 0.1 /100 | #281 | Tragic 5.7% |
| Ottawa | 0.1 /100 | #282 | Tragic 5.7% |
| Cypriots | 0.1 /100 | #283 | Tragic 5.7% |
| Chippewa | 0.1 /100 | #284 | Tragic 5.7% |
| Immigrants | Sierra Leone | 0.1 /100 | #285 | Tragic 5.7% |
| Marshallese | 0.1 /100 | #286 | Tragic 5.7% |
| Central American Indians | 0.0 /100 | #287 | Tragic 5.7% |
| Central Americans | 0.0 /100 | #288 | Tragic 5.7% |
| Immigrants | Somalia | 0.0 /100 | #289 | Tragic 5.7% |
| Spanish American Indians | 0.0 /100 | #290 | Tragic 5.7% |