Lebanese vs Greek Unemployment Among Women with Children Ages 6 to 17 years
COMPARE
Lebanese
Greek
Unemployment Among Women with Children Ages 6 to 17 years
Unemployment Among Women with Children Ages 6 to 17 years Comparison
Lebanese
Greeks
9.5%
UNEMPLOYMENT AMONG WOMEN WITH CHILDREN AGES 6 TO 17 YEARS
0.5/ 100
METRIC RATING
263rd/ 347
METRIC RANK
8.9%
UNEMPLOYMENT AMONG WOMEN WITH CHILDREN AGES 6 TO 17 YEARS
75.2/ 100
METRIC RATING
150th/ 347
METRIC RANK
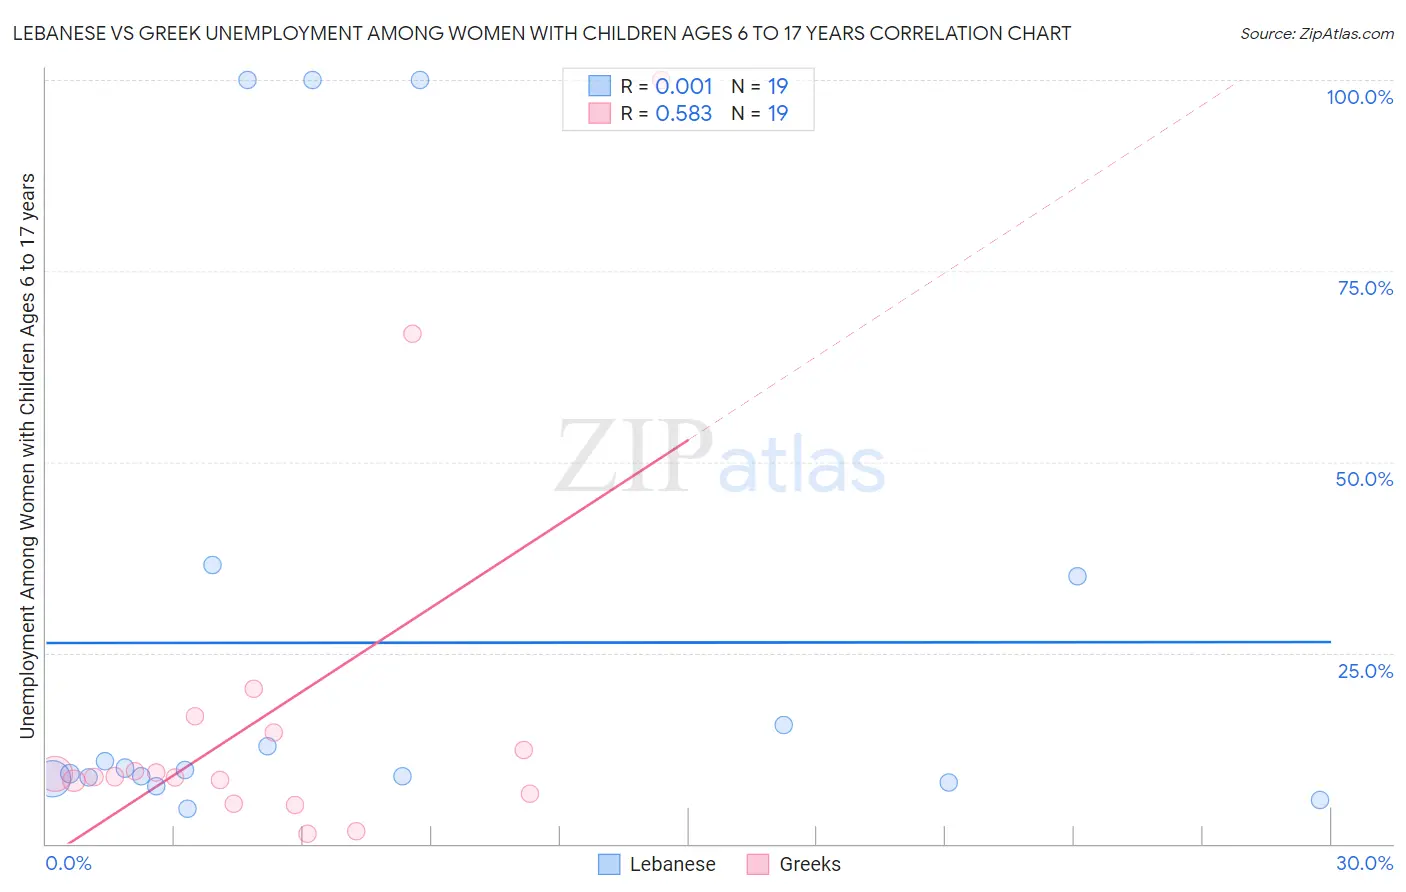
Lebanese vs Greek Unemployment Among Women with Children Ages 6 to 17 years Correlation Chart
The statistical analysis conducted on geographies consisting of 283,181,841 people shows no correlation between the proportion of Lebanese and unemployment rate among women with children between the ages 6 and 17 in the United States with a correlation coefficient (R) of 0.001 and weighted average of 9.5%. Similarly, the statistical analysis conducted on geographies consisting of 323,893,189 people shows a substantial positive correlation between the proportion of Greeks and unemployment rate among women with children between the ages 6 and 17 in the United States with a correlation coefficient (R) of 0.583 and weighted average of 8.9%, a difference of 7.2%.
Unemployment Among Women with Children Ages 6 to 17 years Correlation Summary
| Measurement | Lebanese | Greek |
| Minimum | 4.6% | 1.3% |
| Maximum | 100.0% | 100.0% |
| Range | 95.4% | 98.7% |
| Mean | 26.3% | 16.9% |
| Median | 9.6% | 8.8% |
| Interquartile 25% (IQ1) | 8.5% | 6.5% |
| Interquartile 75% (IQ3) | 35.1% | 14.6% |
| Interquartile Range (IQR) | 26.6% | 8.1% |
| Standard Deviation (Sample) | 33.9% | 24.5% |
| Standard Deviation (Population) | 33.0% | 23.8% |
Similar Demographics by Unemployment Among Women with Children Ages 6 to 17 years
Demographics Similar to Lebanese by Unemployment Among Women with Children Ages 6 to 17 years
In terms of unemployment among women with children ages 6 to 17 years, the demographic groups most similar to Lebanese are Senegalese (9.5%, a difference of 0.040%), South American (9.5%, a difference of 0.090%), Italian (9.5%, a difference of 0.18%), Immigrants from Ghana (9.5%, a difference of 0.24%), and West Indian (9.5%, a difference of 0.27%).
| Demographics | Rating | Rank | Unemployment Among Women with Children Ages 6 to 17 years |
| Canadians | 0.8 /100 | #256 | Tragic 9.4% |
| Celtics | 0.7 /100 | #257 | Tragic 9.5% |
| Immigrants | Mexico | 0.7 /100 | #258 | Tragic 9.5% |
| Immigrants | Central America | 0.6 /100 | #259 | Tragic 9.5% |
| Italians | 0.6 /100 | #260 | Tragic 9.5% |
| South Americans | 0.5 /100 | #261 | Tragic 9.5% |
| Senegalese | 0.5 /100 | #262 | Tragic 9.5% |
| Lebanese | 0.5 /100 | #263 | Tragic 9.5% |
| Immigrants | Ghana | 0.4 /100 | #264 | Tragic 9.5% |
| West Indians | 0.4 /100 | #265 | Tragic 9.5% |
| Immigrants | Jamaica | 0.3 /100 | #266 | Tragic 9.5% |
| Irish | 0.3 /100 | #267 | Tragic 9.5% |
| Ghanaians | 0.2 /100 | #268 | Tragic 9.6% |
| Blackfeet | 0.2 /100 | #269 | Tragic 9.6% |
| Immigrants | Nicaragua | 0.2 /100 | #270 | Tragic 9.6% |
Demographics Similar to Greeks by Unemployment Among Women with Children Ages 6 to 17 years
In terms of unemployment among women with children ages 6 to 17 years, the demographic groups most similar to Greeks are Immigrants from Eastern Africa (8.9%, a difference of 0.040%), Immigrants from Northern Europe (8.9%, a difference of 0.040%), Croatian (8.8%, a difference of 0.050%), Costa Rican (8.8%, a difference of 0.11%), and Immigrants from Europe (8.9%, a difference of 0.11%).
| Demographics | Rating | Rank | Unemployment Among Women with Children Ages 6 to 17 years |
| Immigrants | Kenya | 86.1 /100 | #143 | Excellent 8.8% |
| Russians | 85.8 /100 | #144 | Excellent 8.8% |
| Kenyans | 85.6 /100 | #145 | Excellent 8.8% |
| Chileans | 80.8 /100 | #146 | Excellent 8.8% |
| Immigrants | Bangladesh | 79.4 /100 | #147 | Good 8.8% |
| Costa Ricans | 77.0 /100 | #148 | Good 8.8% |
| Croatians | 76.0 /100 | #149 | Good 8.8% |
| Greeks | 75.2 /100 | #150 | Good 8.9% |
| Immigrants | Eastern Africa | 74.6 /100 | #151 | Good 8.9% |
| Immigrants | Northern Europe | 74.6 /100 | #152 | Good 8.9% |
| Immigrants | Europe | 73.4 /100 | #153 | Good 8.9% |
| Vietnamese | 72.1 /100 | #154 | Good 8.9% |
| Immigrants | Greece | 71.8 /100 | #155 | Good 8.9% |
| Osage | 65.9 /100 | #156 | Good 8.9% |
| Immigrants | Belgium | 65.6 /100 | #157 | Good 8.9% |