Immigrants from Cuba vs Greek Unemployment Among Women with Children Ages 6 to 17 years
COMPARE
Immigrants from Cuba
Greek
Unemployment Among Women with Children Ages 6 to 17 years
Unemployment Among Women with Children Ages 6 to 17 years Comparison
Immigrants from Cuba
Greeks
9.2%
UNEMPLOYMENT AMONG WOMEN WITH CHILDREN AGES 6 TO 17 YEARS
9.6/ 100
METRIC RATING
211th/ 347
METRIC RANK
8.9%
UNEMPLOYMENT AMONG WOMEN WITH CHILDREN AGES 6 TO 17 YEARS
75.2/ 100
METRIC RATING
150th/ 347
METRIC RANK
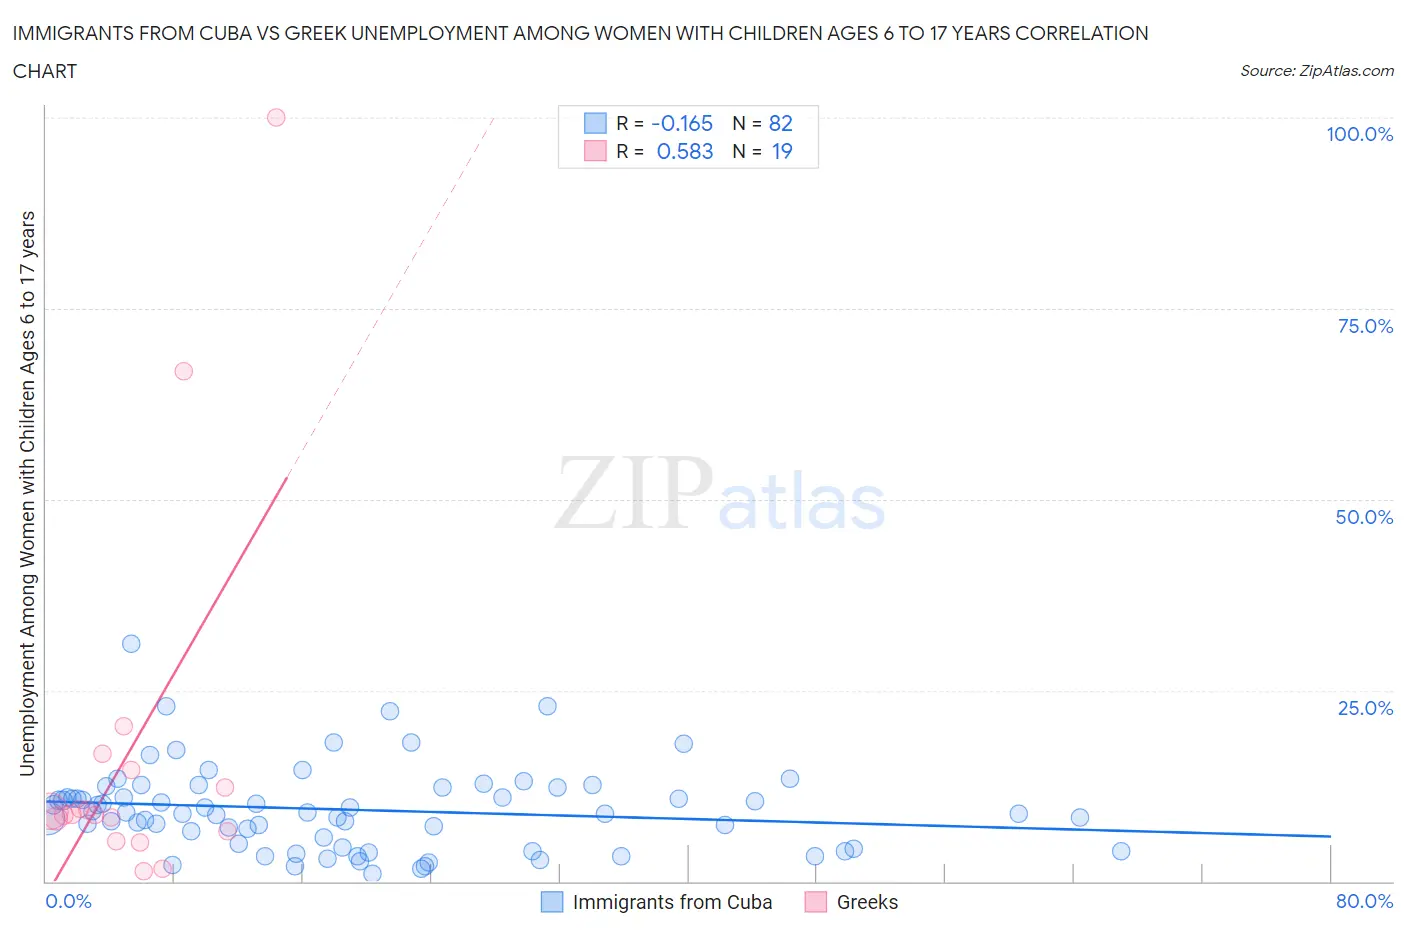
Immigrants from Cuba vs Greek Unemployment Among Women with Children Ages 6 to 17 years Correlation Chart
The statistical analysis conducted on geographies consisting of 247,117,453 people shows a poor negative correlation between the proportion of Immigrants from Cuba and unemployment rate among women with children between the ages 6 and 17 in the United States with a correlation coefficient (R) of -0.165 and weighted average of 9.2%. Similarly, the statistical analysis conducted on geographies consisting of 323,893,189 people shows a substantial positive correlation between the proportion of Greeks and unemployment rate among women with children between the ages 6 and 17 in the United States with a correlation coefficient (R) of 0.583 and weighted average of 8.9%, a difference of 3.8%.
Unemployment Among Women with Children Ages 6 to 17 years Correlation Summary
| Measurement | Immigrants from Cuba | Greek |
| Minimum | 1.0% | 1.3% |
| Maximum | 31.1% | 100.0% |
| Range | 30.1% | 98.7% |
| Mean | 9.4% | 16.9% |
| Median | 9.0% | 8.8% |
| Interquartile 25% (IQ1) | 5.0% | 6.5% |
| Interquartile 75% (IQ3) | 12.2% | 14.6% |
| Interquartile Range (IQR) | 7.2% | 8.1% |
| Standard Deviation (Sample) | 5.5% | 24.5% |
| Standard Deviation (Population) | 5.5% | 23.8% |
Similar Demographics by Unemployment Among Women with Children Ages 6 to 17 years
Demographics Similar to Immigrants from Cuba by Unemployment Among Women with Children Ages 6 to 17 years
In terms of unemployment among women with children ages 6 to 17 years, the demographic groups most similar to Immigrants from Cuba are Finnish (9.2%, a difference of 0.050%), Peruvian (9.2%, a difference of 0.080%), Salvadoran (9.2%, a difference of 0.14%), Cuban (9.2%, a difference of 0.15%), and Immigrants from Peru (9.2%, a difference of 0.15%).
| Demographics | Rating | Rank | Unemployment Among Women with Children Ages 6 to 17 years |
| Immigrants | Canada | 15.3 /100 | #204 | Poor 9.1% |
| Immigrants | Western Europe | 14.1 /100 | #205 | Poor 9.1% |
| Immigrants | North America | 12.7 /100 | #206 | Poor 9.2% |
| Cubans | 10.9 /100 | #207 | Poor 9.2% |
| Immigrants | Peru | 10.8 /100 | #208 | Poor 9.2% |
| Salvadorans | 10.7 /100 | #209 | Poor 9.2% |
| Finns | 10.0 /100 | #210 | Tragic 9.2% |
| Immigrants | Cuba | 9.6 /100 | #211 | Tragic 9.2% |
| Peruvians | 9.0 /100 | #212 | Tragic 9.2% |
| Spaniards | 8.2 /100 | #213 | Tragic 9.2% |
| Iroquois | 7.5 /100 | #214 | Tragic 9.2% |
| Immigrants | Germany | 7.2 /100 | #215 | Tragic 9.2% |
| Immigrants | Uruguay | 7.2 /100 | #216 | Tragic 9.2% |
| Germans | 7.2 /100 | #217 | Tragic 9.2% |
| Syrians | 6.9 /100 | #218 | Tragic 9.2% |
Demographics Similar to Greeks by Unemployment Among Women with Children Ages 6 to 17 years
In terms of unemployment among women with children ages 6 to 17 years, the demographic groups most similar to Greeks are Immigrants from Eastern Africa (8.9%, a difference of 0.040%), Immigrants from Northern Europe (8.9%, a difference of 0.040%), Croatian (8.8%, a difference of 0.050%), Costa Rican (8.8%, a difference of 0.11%), and Immigrants from Europe (8.9%, a difference of 0.11%).
| Demographics | Rating | Rank | Unemployment Among Women with Children Ages 6 to 17 years |
| Immigrants | Kenya | 86.1 /100 | #143 | Excellent 8.8% |
| Russians | 85.8 /100 | #144 | Excellent 8.8% |
| Kenyans | 85.6 /100 | #145 | Excellent 8.8% |
| Chileans | 80.8 /100 | #146 | Excellent 8.8% |
| Immigrants | Bangladesh | 79.4 /100 | #147 | Good 8.8% |
| Costa Ricans | 77.0 /100 | #148 | Good 8.8% |
| Croatians | 76.0 /100 | #149 | Good 8.8% |
| Greeks | 75.2 /100 | #150 | Good 8.9% |
| Immigrants | Eastern Africa | 74.6 /100 | #151 | Good 8.9% |
| Immigrants | Northern Europe | 74.6 /100 | #152 | Good 8.9% |
| Immigrants | Europe | 73.4 /100 | #153 | Good 8.9% |
| Vietnamese | 72.1 /100 | #154 | Good 8.9% |
| Immigrants | Greece | 71.8 /100 | #155 | Good 8.9% |
| Osage | 65.9 /100 | #156 | Good 8.9% |
| Immigrants | Belgium | 65.6 /100 | #157 | Good 8.9% |