Immigrants from Eastern Asia vs Scottish Male Unemployment
COMPARE
Immigrants from Eastern Asia
Scottish
Male Unemployment
Male Unemployment Comparison
Immigrants from Eastern Asia
Scottish
5.1%
MALE UNEMPLOYMENT
90.8/ 100
METRIC RATING
111th/ 347
METRIC RANK
4.8%
MALE UNEMPLOYMENT
99.8/ 100
METRIC RATING
29th/ 347
METRIC RANK
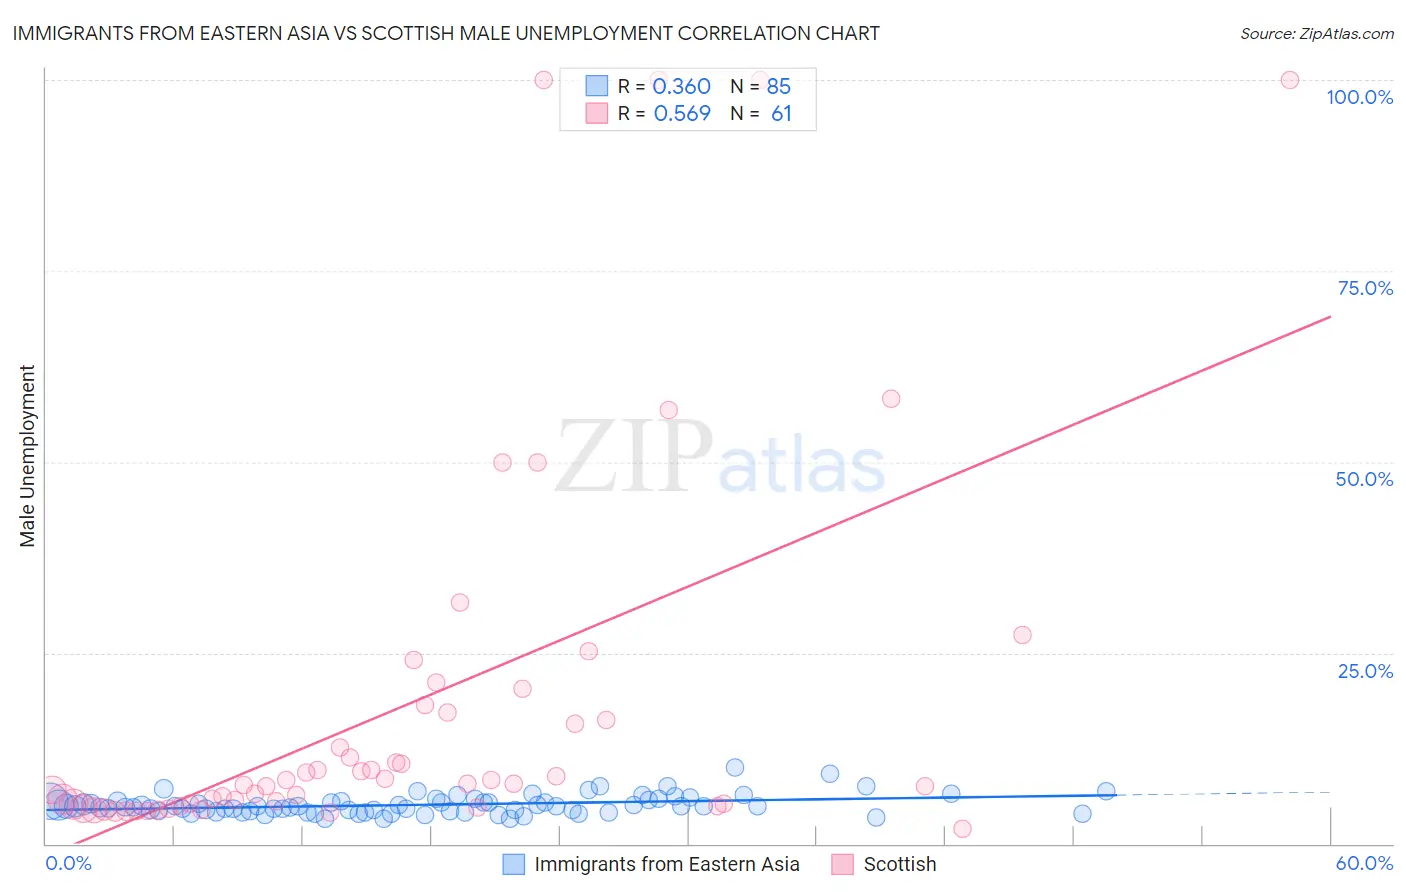
Immigrants from Eastern Asia vs Scottish Male Unemployment Correlation Chart
The statistical analysis conducted on geographies consisting of 496,101,310 people shows a mild positive correlation between the proportion of Immigrants from Eastern Asia and unemployment rate among males in the United States with a correlation coefficient (R) of 0.360 and weighted average of 5.1%. Similarly, the statistical analysis conducted on geographies consisting of 556,190,347 people shows a substantial positive correlation between the proportion of Scottish and unemployment rate among males in the United States with a correlation coefficient (R) of 0.569 and weighted average of 4.8%, a difference of 6.6%.
Male Unemployment Correlation Summary
| Measurement | Immigrants from Eastern Asia | Scottish |
| Minimum | 3.2% | 1.9% |
| Maximum | 10.0% | 100.0% |
| Range | 6.8% | 98.1% |
| Mean | 5.1% | 18.3% |
| Median | 4.9% | 7.9% |
| Interquartile 25% (IQ1) | 4.2% | 5.1% |
| Interquartile 75% (IQ3) | 5.6% | 17.7% |
| Interquartile Range (IQR) | 1.4% | 12.6% |
| Standard Deviation (Sample) | 1.2% | 25.2% |
| Standard Deviation (Population) | 1.2% | 25.0% |
Similar Demographics by Male Unemployment
Demographics Similar to Immigrants from Eastern Asia by Male Unemployment
In terms of male unemployment, the demographic groups most similar to Immigrants from Eastern Asia are Immigrants from England (5.1%, a difference of 0.010%), Immigrants from Pakistan (5.1%, a difference of 0.030%), Immigrants from Moldova (5.1%, a difference of 0.080%), Immigrants from Nicaragua (5.1%, a difference of 0.090%), and Immigrants from Austria (5.1%, a difference of 0.090%).
| Demographics | Rating | Rank | Male Unemployment |
| Immigrants | Chile | 91.8 /100 | #104 | Exceptional 5.1% |
| Immigrants | Czechoslovakia | 91.7 /100 | #105 | Exceptional 5.1% |
| Immigrants | Ethiopia | 91.5 /100 | #106 | Exceptional 5.1% |
| Ethiopians | 91.3 /100 | #107 | Exceptional 5.1% |
| Immigrants | Nicaragua | 91.2 /100 | #108 | Exceptional 5.1% |
| Immigrants | Pakistan | 90.9 /100 | #109 | Exceptional 5.1% |
| Immigrants | England | 90.8 /100 | #110 | Exceptional 5.1% |
| Immigrants | Eastern Asia | 90.8 /100 | #111 | Exceptional 5.1% |
| Immigrants | Moldova | 90.3 /100 | #112 | Exceptional 5.1% |
| Immigrants | Austria | 90.3 /100 | #113 | Exceptional 5.1% |
| Romanians | 89.8 /100 | #114 | Excellent 5.1% |
| Immigrants | Asia | 89.6 /100 | #115 | Excellent 5.1% |
| Immigrants | Denmark | 89.4 /100 | #116 | Excellent 5.1% |
| Estonians | 89.0 /100 | #117 | Excellent 5.1% |
| Cypriots | 88.8 /100 | #118 | Excellent 5.1% |
Demographics Similar to Scottish by Male Unemployment
In terms of male unemployment, the demographic groups most similar to Scottish are Bulgarian (4.8%, a difference of 0.13%), British (4.8%, a difference of 0.31%), Belgian (4.8%, a difference of 0.32%), Dutch (4.8%, a difference of 0.52%), and Zimbabwean (4.8%, a difference of 0.54%).
| Demographics | Rating | Rank | Male Unemployment |
| Carpatho Rusyns | 99.9 /100 | #22 | Exceptional 4.8% |
| Tongans | 99.9 /100 | #23 | Exceptional 4.8% |
| Immigrants | South Central Asia | 99.9 /100 | #24 | Exceptional 4.8% |
| Zimbabweans | 99.9 /100 | #25 | Exceptional 4.8% |
| Dutch | 99.9 /100 | #26 | Exceptional 4.8% |
| Belgians | 99.9 /100 | #27 | Exceptional 4.8% |
| Bulgarians | 99.8 /100 | #28 | Exceptional 4.8% |
| Scottish | 99.8 /100 | #29 | Exceptional 4.8% |
| British | 99.8 /100 | #30 | Exceptional 4.8% |
| Sudanese | 99.8 /100 | #31 | Exceptional 4.8% |
| Immigrants | Nepal | 99.8 /100 | #32 | Exceptional 4.8% |
| Latvians | 99.7 /100 | #33 | Exceptional 4.8% |
| Welsh | 99.7 /100 | #34 | Exceptional 4.8% |
| Paraguayans | 99.5 /100 | #35 | Exceptional 4.9% |
| Immigrants | Singapore | 99.4 /100 | #36 | Exceptional 4.9% |