Carpatho Rusyn vs Austrian Male Unemployment
COMPARE
Carpatho Rusyn
Austrian
Male Unemployment
Male Unemployment Comparison
Carpatho Rusyns
Austrians
4.8%
MALE UNEMPLOYMENT
99.9/ 100
METRIC RATING
22nd/ 347
METRIC RANK
4.9%
MALE UNEMPLOYMENT
98.9/ 100
METRIC RATING
47th/ 347
METRIC RANK
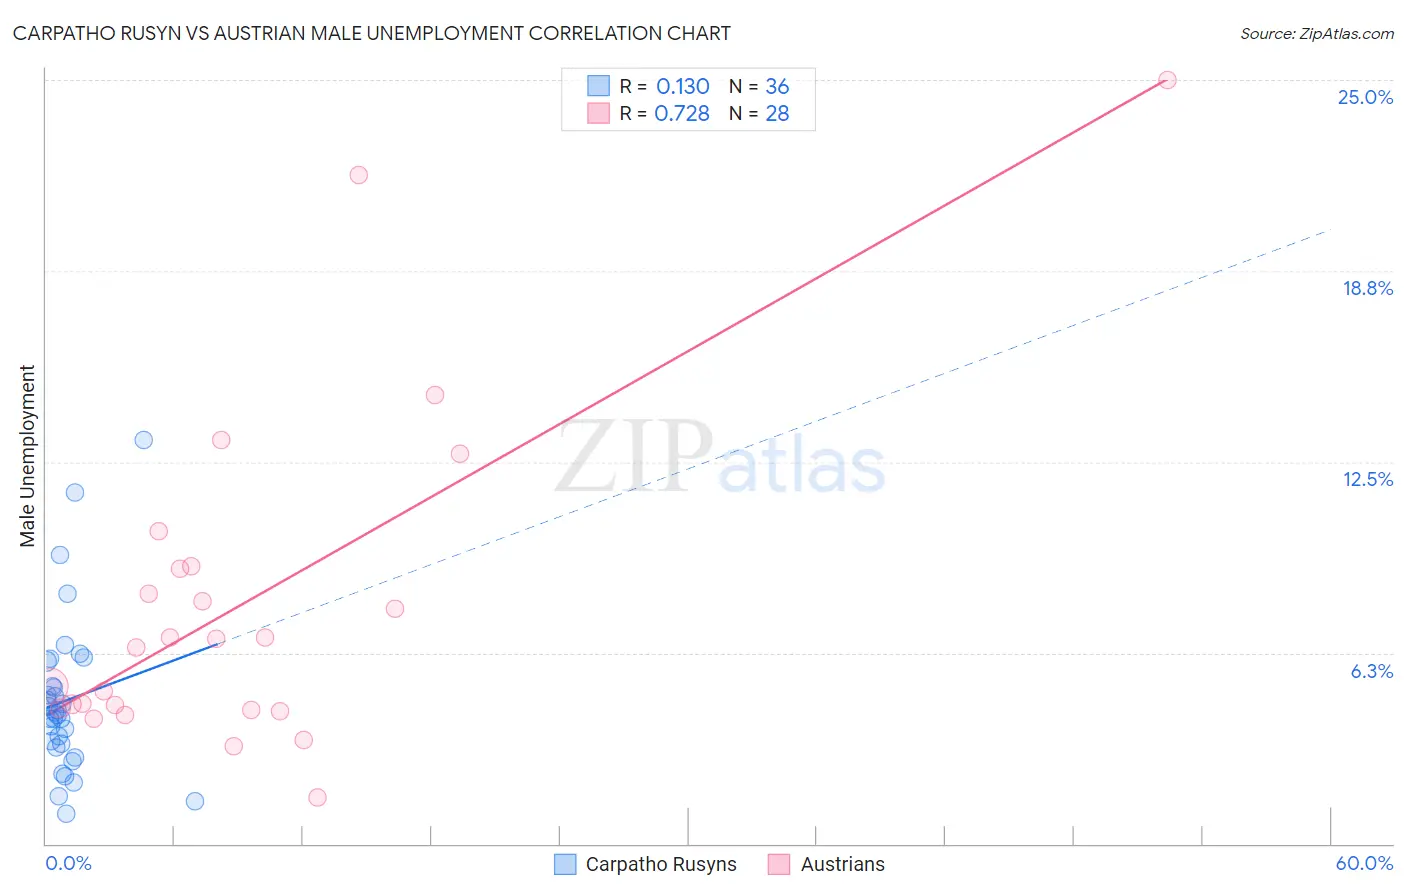
Carpatho Rusyn vs Austrian Male Unemployment Correlation Chart
The statistical analysis conducted on geographies consisting of 58,814,834 people shows a poor positive correlation between the proportion of Carpatho Rusyns and unemployment rate among males in the United States with a correlation coefficient (R) of 0.130 and weighted average of 4.8%. Similarly, the statistical analysis conducted on geographies consisting of 448,962,183 people shows a strong positive correlation between the proportion of Austrians and unemployment rate among males in the United States with a correlation coefficient (R) of 0.728 and weighted average of 4.9%, a difference of 3.7%.
Male Unemployment Correlation Summary
| Measurement | Carpatho Rusyn | Austrian |
| Minimum | 1.0% | 1.5% |
| Maximum | 13.2% | 25.0% |
| Range | 12.2% | 23.5% |
| Mean | 4.7% | 7.8% |
| Median | 4.2% | 6.6% |
| Interquartile 25% (IQ1) | 3.2% | 4.4% |
| Interquartile 75% (IQ3) | 5.6% | 9.0% |
| Interquartile Range (IQR) | 2.4% | 4.6% |
| Standard Deviation (Sample) | 2.6% | 5.4% |
| Standard Deviation (Population) | 2.6% | 5.3% |
Similar Demographics by Male Unemployment
Demographics Similar to Carpatho Rusyns by Male Unemployment
In terms of male unemployment, the demographic groups most similar to Carpatho Rusyns are Immigrants from Taiwan (4.8%, a difference of 0.010%), Tongan (4.8%, a difference of 0.040%), Immigrants from South Central Asia (4.8%, a difference of 0.070%), Pennsylvania German (4.8%, a difference of 0.18%), and Zimbabwean (4.8%, a difference of 0.18%).
| Demographics | Rating | Rank | Male Unemployment |
| Scandinavians | 100.0 /100 | #15 | Exceptional 4.7% |
| Swiss | 99.9 /100 | #16 | Exceptional 4.7% |
| Filipinos | 99.9 /100 | #17 | Exceptional 4.7% |
| English | 99.9 /100 | #18 | Exceptional 4.8% |
| Europeans | 99.9 /100 | #19 | Exceptional 4.8% |
| Pennsylvania Germans | 99.9 /100 | #20 | Exceptional 4.8% |
| Immigrants | Taiwan | 99.9 /100 | #21 | Exceptional 4.8% |
| Carpatho Rusyns | 99.9 /100 | #22 | Exceptional 4.8% |
| Tongans | 99.9 /100 | #23 | Exceptional 4.8% |
| Immigrants | South Central Asia | 99.9 /100 | #24 | Exceptional 4.8% |
| Zimbabweans | 99.9 /100 | #25 | Exceptional 4.8% |
| Dutch | 99.9 /100 | #26 | Exceptional 4.8% |
| Belgians | 99.9 /100 | #27 | Exceptional 4.8% |
| Bulgarians | 99.8 /100 | #28 | Exceptional 4.8% |
| Scottish | 99.8 /100 | #29 | Exceptional 4.8% |
Demographics Similar to Austrians by Male Unemployment
In terms of male unemployment, the demographic groups most similar to Austrians are Immigrants from Scotland (4.9%, a difference of 0.020%), Polish (4.9%, a difference of 0.030%), Croatian (4.9%, a difference of 0.040%), Bhutanese (4.9%, a difference of 0.070%), and Slovene (5.0%, a difference of 0.070%).
| Demographics | Rating | Rank | Male Unemployment |
| Northern Europeans | 99.3 /100 | #40 | Exceptional 4.9% |
| Chinese | 99.3 /100 | #41 | Exceptional 4.9% |
| Immigrants | Belgium | 99.2 /100 | #42 | Exceptional 4.9% |
| Immigrants | Japan | 99.2 /100 | #43 | Exceptional 4.9% |
| Immigrants | Korea | 99.1 /100 | #44 | Exceptional 4.9% |
| Immigrants | Zimbabwe | 99.0 /100 | #45 | Exceptional 4.9% |
| Bhutanese | 98.9 /100 | #46 | Exceptional 4.9% |
| Austrians | 98.9 /100 | #47 | Exceptional 4.9% |
| Immigrants | Scotland | 98.9 /100 | #48 | Exceptional 4.9% |
| Poles | 98.9 /100 | #49 | Exceptional 4.9% |
| Croatians | 98.9 /100 | #50 | Exceptional 4.9% |
| Slovenes | 98.8 /100 | #51 | Exceptional 5.0% |
| Irish | 98.8 /100 | #52 | Exceptional 5.0% |
| Jordanians | 98.8 /100 | #53 | Exceptional 5.0% |
| Yugoslavians | 98.7 /100 | #54 | Exceptional 5.0% |