Ukrainian vs Austrian Male Unemployment
COMPARE
Ukrainian
Austrian
Male Unemployment
Male Unemployment Comparison
Ukrainians
Austrians
5.1%
MALE UNEMPLOYMENT
88.4/ 100
METRIC RATING
120th/ 347
METRIC RANK
4.9%
MALE UNEMPLOYMENT
98.9/ 100
METRIC RATING
47th/ 347
METRIC RANK
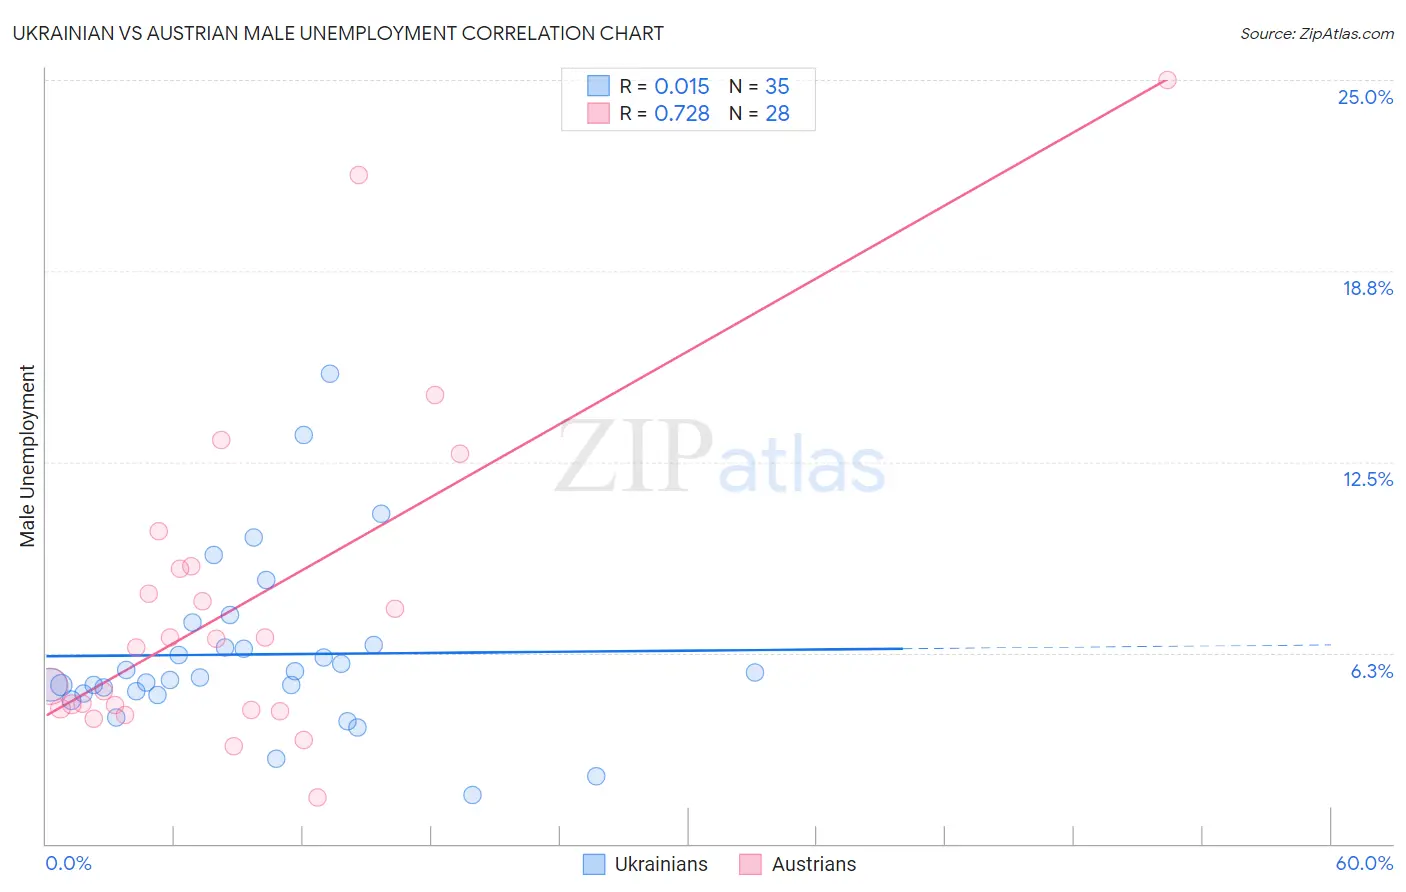
Ukrainian vs Austrian Male Unemployment Correlation Chart
The statistical analysis conducted on geographies consisting of 445,622,080 people shows no correlation between the proportion of Ukrainians and unemployment rate among males in the United States with a correlation coefficient (R) of 0.015 and weighted average of 5.1%. Similarly, the statistical analysis conducted on geographies consisting of 448,962,183 people shows a strong positive correlation between the proportion of Austrians and unemployment rate among males in the United States with a correlation coefficient (R) of 0.728 and weighted average of 4.9%, a difference of 3.8%.
Male Unemployment Correlation Summary
| Measurement | Ukrainian | Austrian |
| Minimum | 1.6% | 1.5% |
| Maximum | 15.4% | 25.0% |
| Range | 13.8% | 23.5% |
| Mean | 6.2% | 7.8% |
| Median | 5.4% | 6.6% |
| Interquartile 25% (IQ1) | 4.9% | 4.4% |
| Interquartile 75% (IQ3) | 6.5% | 9.0% |
| Interquartile Range (IQR) | 1.6% | 4.6% |
| Standard Deviation (Sample) | 2.8% | 5.4% |
| Standard Deviation (Population) | 2.8% | 5.3% |
Similar Demographics by Male Unemployment
Demographics Similar to Ukrainians by Male Unemployment
In terms of male unemployment, the demographic groups most similar to Ukrainians are Mongolian (5.1%, a difference of 0.010%), French Canadian (5.1%, a difference of 0.020%), Nicaraguan (5.1%, a difference of 0.040%), Cypriot (5.1%, a difference of 0.060%), and Estonian (5.1%, a difference of 0.090%).
| Demographics | Rating | Rank | Male Unemployment |
| Immigrants | Austria | 90.3 /100 | #113 | Exceptional 5.1% |
| Romanians | 89.8 /100 | #114 | Excellent 5.1% |
| Immigrants | Asia | 89.6 /100 | #115 | Excellent 5.1% |
| Immigrants | Denmark | 89.4 /100 | #116 | Excellent 5.1% |
| Estonians | 89.0 /100 | #117 | Excellent 5.1% |
| Cypriots | 88.8 /100 | #118 | Excellent 5.1% |
| French Canadians | 88.6 /100 | #119 | Excellent 5.1% |
| Ukrainians | 88.4 /100 | #120 | Excellent 5.1% |
| Mongolians | 88.4 /100 | #121 | Excellent 5.1% |
| Nicaraguans | 88.2 /100 | #122 | Excellent 5.1% |
| Palestinians | 87.7 /100 | #123 | Excellent 5.1% |
| Immigrants | Latvia | 87.5 /100 | #124 | Excellent 5.1% |
| Immigrants | Lithuania | 87.2 /100 | #125 | Excellent 5.1% |
| Immigrants | Colombia | 86.8 /100 | #126 | Excellent 5.1% |
| Immigrants | Brazil | 86.3 /100 | #127 | Excellent 5.2% |
Demographics Similar to Austrians by Male Unemployment
In terms of male unemployment, the demographic groups most similar to Austrians are Immigrants from Scotland (4.9%, a difference of 0.020%), Polish (4.9%, a difference of 0.030%), Croatian (4.9%, a difference of 0.040%), Bhutanese (4.9%, a difference of 0.070%), and Slovene (5.0%, a difference of 0.070%).
| Demographics | Rating | Rank | Male Unemployment |
| Northern Europeans | 99.3 /100 | #40 | Exceptional 4.9% |
| Chinese | 99.3 /100 | #41 | Exceptional 4.9% |
| Immigrants | Belgium | 99.2 /100 | #42 | Exceptional 4.9% |
| Immigrants | Japan | 99.2 /100 | #43 | Exceptional 4.9% |
| Immigrants | Korea | 99.1 /100 | #44 | Exceptional 4.9% |
| Immigrants | Zimbabwe | 99.0 /100 | #45 | Exceptional 4.9% |
| Bhutanese | 98.9 /100 | #46 | Exceptional 4.9% |
| Austrians | 98.9 /100 | #47 | Exceptional 4.9% |
| Immigrants | Scotland | 98.9 /100 | #48 | Exceptional 4.9% |
| Poles | 98.9 /100 | #49 | Exceptional 4.9% |
| Croatians | 98.9 /100 | #50 | Exceptional 4.9% |
| Slovenes | 98.8 /100 | #51 | Exceptional 5.0% |
| Irish | 98.8 /100 | #52 | Exceptional 5.0% |
| Jordanians | 98.8 /100 | #53 | Exceptional 5.0% |
| Yugoslavians | 98.7 /100 | #54 | Exceptional 5.0% |