Kiowa vs Immigrants from Spain Unemployment Among Ages 60 to 64 years
COMPARE
Kiowa
Immigrants from Spain
Unemployment Among Ages 60 to 64 years
Unemployment Among Ages 60 to 64 years Comparison
Kiowa
Immigrants from Spain
6.2%
UNEMPLOYMENT AMONG AGES 60 TO 64 YEARS
0.0/ 100
METRIC RATING
336th/ 347
METRIC RANK
5.2%
UNEMPLOYMENT AMONG AGES 60 TO 64 YEARS
0.1/ 100
METRIC RATING
273rd/ 347
METRIC RANK
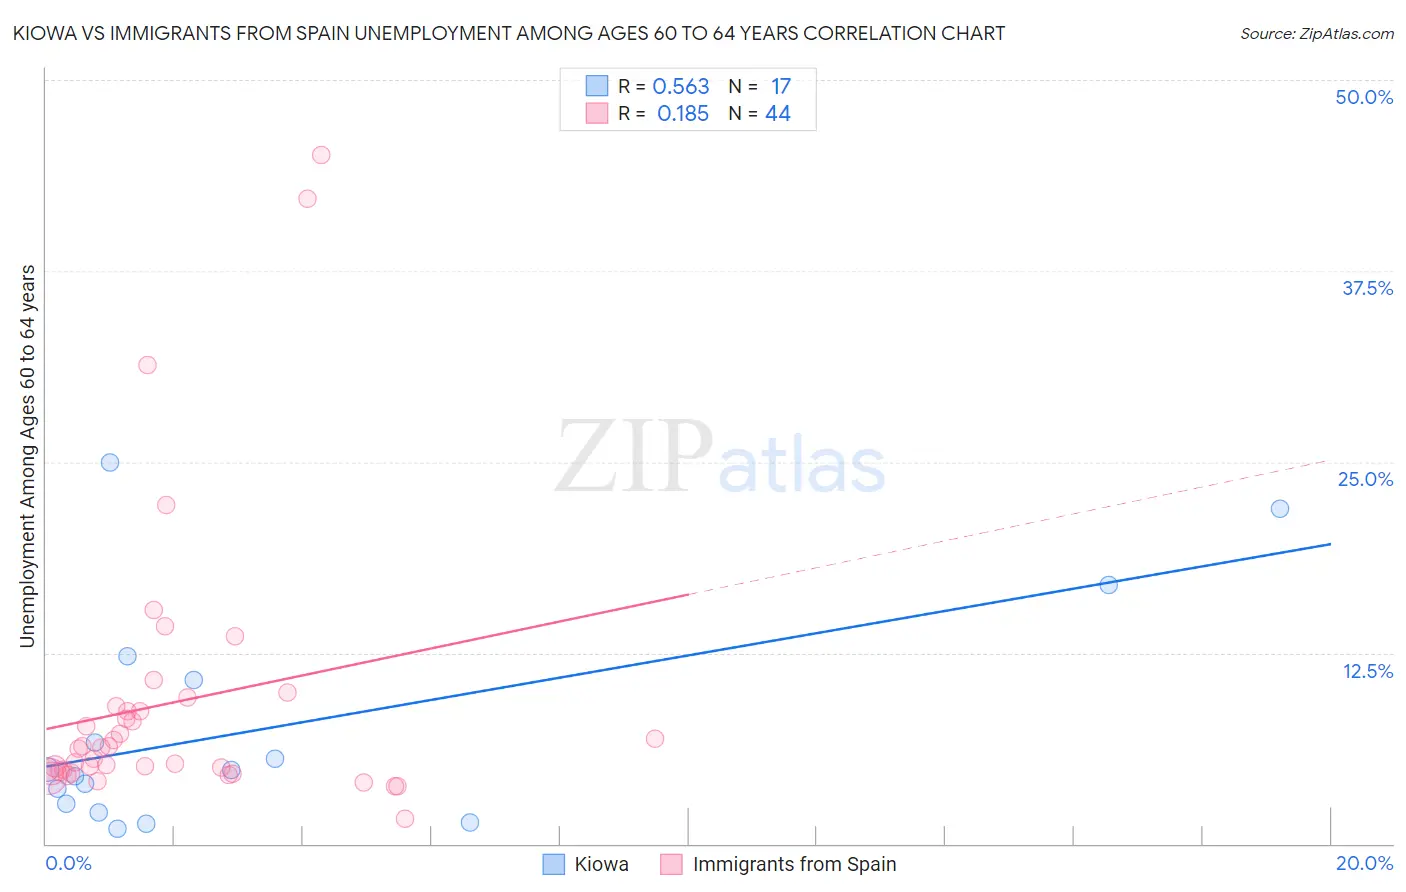
Kiowa vs Immigrants from Spain Unemployment Among Ages 60 to 64 years Correlation Chart
The statistical analysis conducted on geographies consisting of 54,128,146 people shows a substantial positive correlation between the proportion of Kiowa and unemployment rate among population between the ages 60 and 64 in the United States with a correlation coefficient (R) of 0.563 and weighted average of 6.2%. Similarly, the statistical analysis conducted on geographies consisting of 226,488,675 people shows a poor positive correlation between the proportion of Immigrants from Spain and unemployment rate among population between the ages 60 and 64 in the United States with a correlation coefficient (R) of 0.185 and weighted average of 5.2%, a difference of 20.0%.
Unemployment Among Ages 60 to 64 years Correlation Summary
| Measurement | Kiowa | Immigrants from Spain |
| Minimum | 0.98% | 1.6% |
| Maximum | 25.0% | 45.1% |
| Range | 24.0% | 43.5% |
| Mean | 7.6% | 9.2% |
| Median | 4.8% | 6.3% |
| Interquartile 25% (IQ1) | 2.3% | 4.7% |
| Interquartile 75% (IQ3) | 11.5% | 8.9% |
| Interquartile Range (IQR) | 9.2% | 4.2% |
| Standard Deviation (Sample) | 7.3% | 9.2% |
| Standard Deviation (Population) | 7.1% | 9.1% |
Similar Demographics by Unemployment Among Ages 60 to 64 years
Demographics Similar to Kiowa by Unemployment Among Ages 60 to 64 years
In terms of unemployment among ages 60 to 64 years, the demographic groups most similar to Kiowa are Navajo (6.3%, a difference of 1.1%), Arapaho (6.3%, a difference of 1.6%), Vietnamese (6.1%, a difference of 2.0%), Puerto Rican (6.1%, a difference of 2.1%), and Tlingit-Haida (6.4%, a difference of 3.0%).
| Demographics | Rating | Rank | Unemployment Among Ages 60 to 64 years |
| Immigrants | Bangladesh | 0.0 /100 | #329 | Tragic 6.0% |
| Immigrants | Armenia | 0.0 /100 | #330 | Tragic 6.0% |
| Yakama | 0.0 /100 | #331 | Tragic 6.0% |
| Dominicans | 0.0 /100 | #332 | Tragic 6.0% |
| Immigrants | Dominican Republic | 0.0 /100 | #333 | Tragic 6.0% |
| Puerto Ricans | 0.0 /100 | #334 | Tragic 6.1% |
| Vietnamese | 0.0 /100 | #335 | Tragic 6.1% |
| Kiowa | 0.0 /100 | #336 | Tragic 6.2% |
| Navajo | 0.0 /100 | #337 | Tragic 6.3% |
| Arapaho | 0.0 /100 | #338 | Tragic 6.3% |
| Tlingit-Haida | 0.0 /100 | #339 | Tragic 6.4% |
| Pueblo | 0.0 /100 | #340 | Tragic 6.7% |
| Yuman | 0.0 /100 | #341 | Tragic 6.8% |
| Aleuts | 0.0 /100 | #342 | Tragic 6.8% |
| Immigrants | Yemen | 0.0 /100 | #343 | Tragic 6.8% |
Demographics Similar to Immigrants from Spain by Unemployment Among Ages 60 to 64 years
In terms of unemployment among ages 60 to 64 years, the demographic groups most similar to Immigrants from Spain are Haitian (5.2%, a difference of 0.070%), Israeli (5.2%, a difference of 0.10%), Hopi (5.2%, a difference of 0.14%), Immigrants from Hong Kong (5.2%, a difference of 0.28%), and Immigrants from Iran (5.1%, a difference of 0.37%).
| Demographics | Rating | Rank | Unemployment Among Ages 60 to 64 years |
| Immigrants | Australia | 0.2 /100 | #266 | Tragic 5.1% |
| Immigrants | Bahamas | 0.2 /100 | #267 | Tragic 5.1% |
| Central American Indians | 0.2 /100 | #268 | Tragic 5.1% |
| Immigrants | Costa Rica | 0.2 /100 | #269 | Tragic 5.1% |
| Immigrants | Iran | 0.1 /100 | #270 | Tragic 5.1% |
| Israelis | 0.1 /100 | #271 | Tragic 5.2% |
| Haitians | 0.1 /100 | #272 | Tragic 5.2% |
| Immigrants | Spain | 0.1 /100 | #273 | Tragic 5.2% |
| Hopi | 0.1 /100 | #274 | Tragic 5.2% |
| Immigrants | Hong Kong | 0.1 /100 | #275 | Tragic 5.2% |
| Central Americans | 0.0 /100 | #276 | Tragic 5.2% |
| Immigrants | Caribbean | 0.0 /100 | #277 | Tragic 5.2% |
| Guatemalans | 0.0 /100 | #278 | Tragic 5.2% |
| Nepalese | 0.0 /100 | #279 | Tragic 5.2% |
| French American Indians | 0.0 /100 | #280 | Tragic 5.2% |