Kenyan vs Central American Unemployment Among Women with Children Under 6 years
COMPARE
Kenyan
Central American
Unemployment Among Women with Children Under 6 years
Unemployment Among Women with Children Under 6 years Comparison
Kenyans
Central Americans
7.6%
UNEMPLOYMENT AMONG WOMEN WITH CHILDREN UNDER 6 YEARS
62.5/ 100
METRIC RATING
167th/ 347
METRIC RANK
8.2%
UNEMPLOYMENT AMONG WOMEN WITH CHILDREN UNDER 6 YEARS
1.4/ 100
METRIC RATING
246th/ 347
METRIC RANK
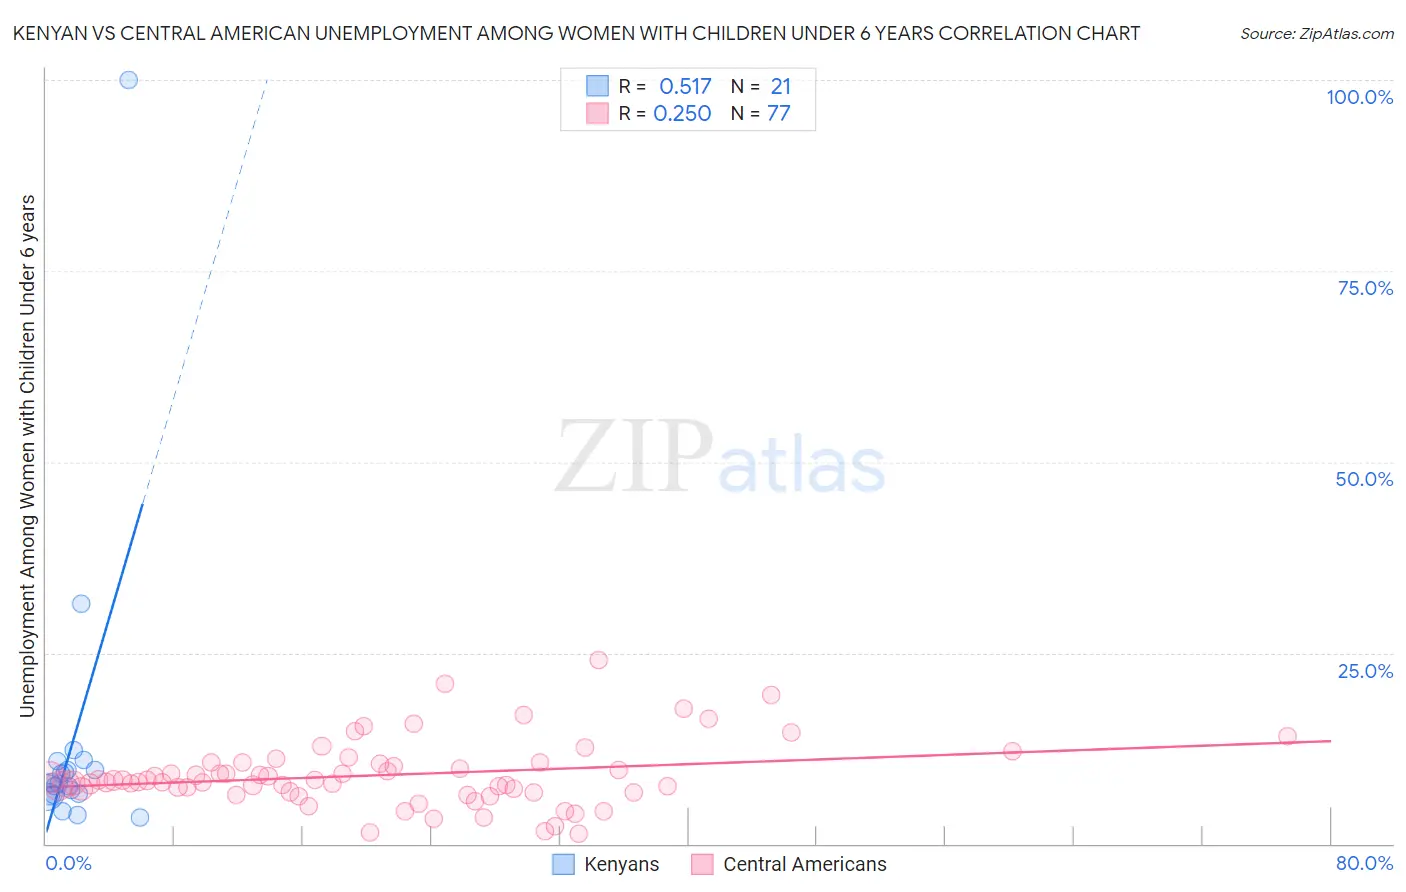
Kenyan vs Central American Unemployment Among Women with Children Under 6 years Correlation Chart
The statistical analysis conducted on geographies consisting of 147,179,108 people shows a substantial positive correlation between the proportion of Kenyans and unemployment rate among women with children under the age of 6 in the United States with a correlation coefficient (R) of 0.517 and weighted average of 7.6%. Similarly, the statistical analysis conducted on geographies consisting of 361,380,642 people shows a weak positive correlation between the proportion of Central Americans and unemployment rate among women with children under the age of 6 in the United States with a correlation coefficient (R) of 0.250 and weighted average of 8.2%, a difference of 8.0%.
Unemployment Among Women with Children Under 6 years Correlation Summary
| Measurement | Kenyan | Central American |
| Minimum | 3.5% | 1.3% |
| Maximum | 100.0% | 24.0% |
| Range | 96.5% | 22.7% |
| Mean | 13.3% | 9.0% |
| Median | 7.9% | 8.1% |
| Interquartile 25% (IQ1) | 6.5% | 6.8% |
| Interquartile 75% (IQ3) | 10.2% | 10.5% |
| Interquartile Range (IQR) | 3.8% | 3.8% |
| Standard Deviation (Sample) | 20.6% | 4.3% |
| Standard Deviation (Population) | 20.2% | 4.3% |
Similar Demographics by Unemployment Among Women with Children Under 6 years
Demographics Similar to Kenyans by Unemployment Among Women with Children Under 6 years
In terms of unemployment among women with children under 6 years, the demographic groups most similar to Kenyans are Belgian (7.6%, a difference of 0.070%), Immigrants from Canada (7.6%, a difference of 0.070%), Immigrants from Scotland (7.6%, a difference of 0.080%), Czech (7.6%, a difference of 0.19%), and Immigrants from South America (7.6%, a difference of 0.22%).
| Demographics | Rating | Rank | Unemployment Among Women with Children Under 6 years |
| Bolivians | 70.8 /100 | #160 | Good 7.5% |
| Immigrants | Western Asia | 70.2 /100 | #161 | Good 7.5% |
| Immigrants | Lithuania | 68.8 /100 | #162 | Good 7.5% |
| British | 66.3 /100 | #163 | Good 7.6% |
| Ugandans | 65.8 /100 | #164 | Good 7.6% |
| Immigrants | South America | 65.6 /100 | #165 | Good 7.6% |
| Belgians | 63.5 /100 | #166 | Good 7.6% |
| Kenyans | 62.5 /100 | #167 | Good 7.6% |
| Immigrants | Canada | 61.6 /100 | #168 | Good 7.6% |
| Immigrants | Scotland | 61.3 /100 | #169 | Good 7.6% |
| Czechs | 59.8 /100 | #170 | Average 7.6% |
| Immigrants | Grenada | 59.0 /100 | #171 | Average 7.6% |
| Immigrants | North America | 57.7 /100 | #172 | Average 7.6% |
| Cree | 51.6 /100 | #173 | Average 7.6% |
| Immigrants | Laos | 50.0 /100 | #174 | Average 7.6% |
Demographics Similar to Central Americans by Unemployment Among Women with Children Under 6 years
In terms of unemployment among women with children under 6 years, the demographic groups most similar to Central Americans are German Russian (8.2%, a difference of 0.28%), Immigrants from Western Africa (8.2%, a difference of 0.32%), Native Hawaiian (8.2%, a difference of 0.33%), French (8.2%, a difference of 0.34%), and Hawaiian (8.2%, a difference of 0.37%).
| Demographics | Rating | Rank | Unemployment Among Women with Children Under 6 years |
| Irish | 2.7 /100 | #239 | Tragic 8.1% |
| Immigrants | El Salvador | 2.6 /100 | #240 | Tragic 8.1% |
| Liberians | 2.6 /100 | #241 | Tragic 8.1% |
| Dutch | 2.5 /100 | #242 | Tragic 8.1% |
| Hawaiians | 1.8 /100 | #243 | Tragic 8.2% |
| French | 1.7 /100 | #244 | Tragic 8.2% |
| Native Hawaiians | 1.7 /100 | #245 | Tragic 8.2% |
| Central Americans | 1.4 /100 | #246 | Tragic 8.2% |
| German Russians | 1.2 /100 | #247 | Tragic 8.2% |
| Immigrants | Western Africa | 1.1 /100 | #248 | Tragic 8.2% |
| Immigrants | Sierra Leone | 1.1 /100 | #249 | Tragic 8.2% |
| Nigerians | 1.1 /100 | #250 | Tragic 8.2% |
| Guyanese | 1.0 /100 | #251 | Tragic 8.2% |
| Ghanaians | 1.0 /100 | #252 | Tragic 8.2% |
| Immigrants | Guyana | 0.8 /100 | #253 | Tragic 8.2% |