Carpatho Rusyn vs Iranian Male Unemployment
COMPARE
Carpatho Rusyn
Iranian
Male Unemployment
Male Unemployment Comparison
Carpatho Rusyns
Iranians
4.8%
MALE UNEMPLOYMENT
99.9/ 100
METRIC RATING
22nd/ 347
METRIC RANK
5.0%
MALE UNEMPLOYMENT
96.4/ 100
METRIC RATING
77th/ 347
METRIC RANK
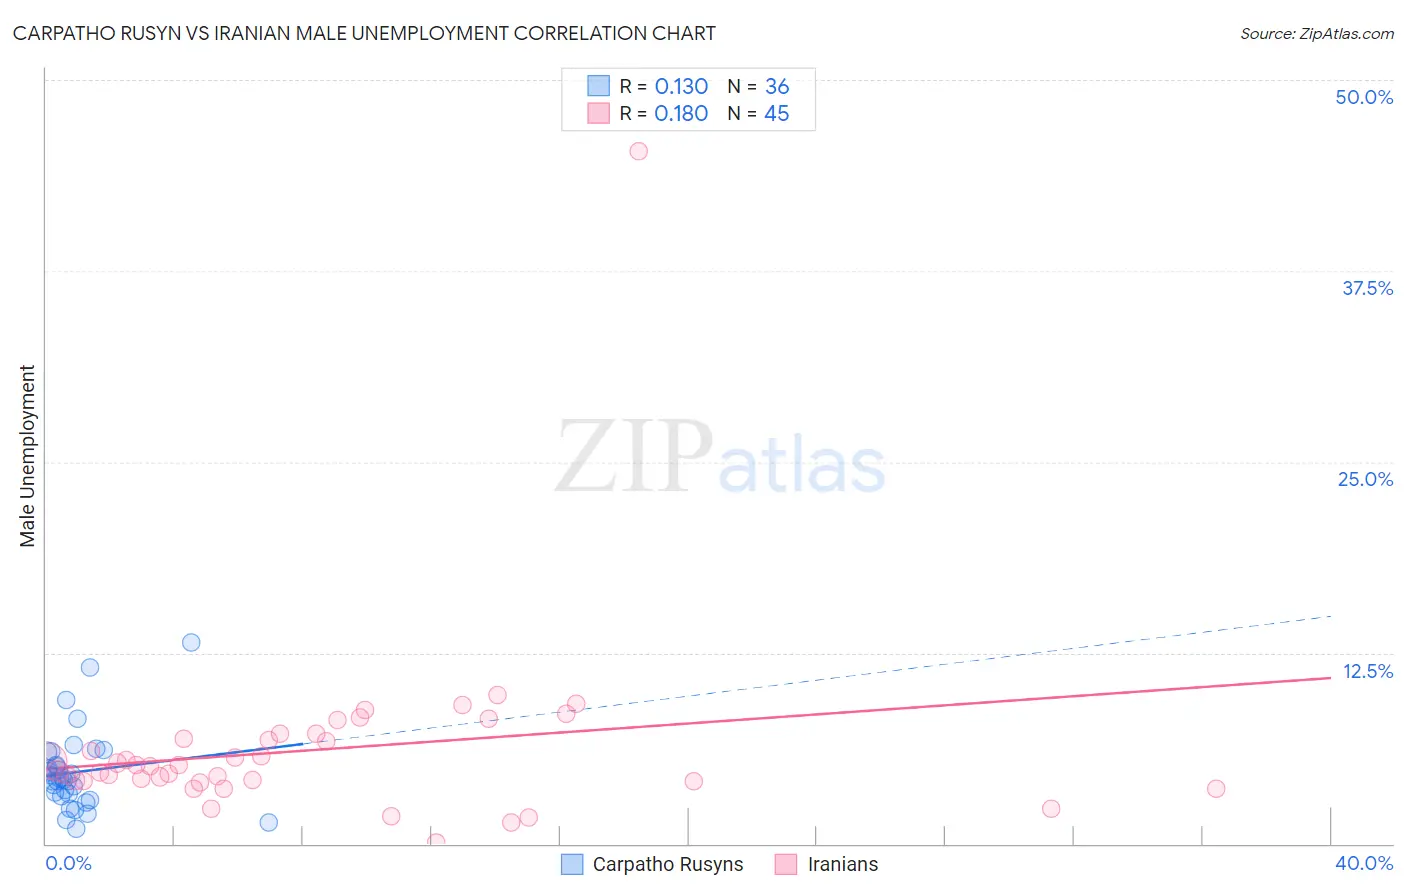
Carpatho Rusyn vs Iranian Male Unemployment Correlation Chart
The statistical analysis conducted on geographies consisting of 58,814,834 people shows a poor positive correlation between the proportion of Carpatho Rusyns and unemployment rate among males in the United States with a correlation coefficient (R) of 0.130 and weighted average of 4.8%. Similarly, the statistical analysis conducted on geographies consisting of 316,157,253 people shows a poor positive correlation between the proportion of Iranians and unemployment rate among males in the United States with a correlation coefficient (R) of 0.180 and weighted average of 5.0%, a difference of 5.7%.
Male Unemployment Correlation Summary
| Measurement | Carpatho Rusyn | Iranian |
| Minimum | 1.0% | 0.10% |
| Maximum | 13.2% | 45.3% |
| Range | 12.2% | 45.2% |
| Mean | 4.7% | 6.1% |
| Median | 4.2% | 5.1% |
| Interquartile 25% (IQ1) | 3.2% | 4.1% |
| Interquartile 75% (IQ3) | 5.6% | 7.0% |
| Interquartile Range (IQR) | 2.4% | 2.9% |
| Standard Deviation (Sample) | 2.6% | 6.4% |
| Standard Deviation (Population) | 2.6% | 6.3% |
Similar Demographics by Male Unemployment
Demographics Similar to Carpatho Rusyns by Male Unemployment
In terms of male unemployment, the demographic groups most similar to Carpatho Rusyns are Immigrants from Taiwan (4.8%, a difference of 0.010%), Tongan (4.8%, a difference of 0.040%), Immigrants from South Central Asia (4.8%, a difference of 0.070%), Pennsylvania German (4.8%, a difference of 0.18%), and Zimbabwean (4.8%, a difference of 0.18%).
| Demographics | Rating | Rank | Male Unemployment |
| Scandinavians | 100.0 /100 | #15 | Exceptional 4.7% |
| Swiss | 99.9 /100 | #16 | Exceptional 4.7% |
| Filipinos | 99.9 /100 | #17 | Exceptional 4.7% |
| English | 99.9 /100 | #18 | Exceptional 4.8% |
| Europeans | 99.9 /100 | #19 | Exceptional 4.8% |
| Pennsylvania Germans | 99.9 /100 | #20 | Exceptional 4.8% |
| Immigrants | Taiwan | 99.9 /100 | #21 | Exceptional 4.8% |
| Carpatho Rusyns | 99.9 /100 | #22 | Exceptional 4.8% |
| Tongans | 99.9 /100 | #23 | Exceptional 4.8% |
| Immigrants | South Central Asia | 99.9 /100 | #24 | Exceptional 4.8% |
| Zimbabweans | 99.9 /100 | #25 | Exceptional 4.8% |
| Dutch | 99.9 /100 | #26 | Exceptional 4.8% |
| Belgians | 99.9 /100 | #27 | Exceptional 4.8% |
| Bulgarians | 99.8 /100 | #28 | Exceptional 4.8% |
| Scottish | 99.8 /100 | #29 | Exceptional 4.8% |
Demographics Similar to Iranians by Male Unemployment
In terms of male unemployment, the demographic groups most similar to Iranians are Immigrants from Northern Europe (5.0%, a difference of 0.010%), South African (5.0%, a difference of 0.020%), Immigrants from Sudan (5.0%, a difference of 0.050%), Argentinean (5.0%, a difference of 0.080%), and French (5.0%, a difference of 0.080%).
| Demographics | Rating | Rank | Male Unemployment |
| Whites/Caucasians | 97.3 /100 | #70 | Exceptional 5.0% |
| New Zealanders | 97.3 /100 | #71 | Exceptional 5.0% |
| Immigrants | South Africa | 97.1 /100 | #72 | Exceptional 5.0% |
| Greeks | 97.0 /100 | #73 | Exceptional 5.0% |
| Immigrants | North America | 96.9 /100 | #74 | Exceptional 5.0% |
| Assyrians/Chaldeans/Syriacs | 96.9 /100 | #75 | Exceptional 5.0% |
| Immigrants | Sudan | 96.5 /100 | #76 | Exceptional 5.0% |
| Iranians | 96.4 /100 | #77 | Exceptional 5.0% |
| Immigrants | Northern Europe | 96.4 /100 | #78 | Exceptional 5.0% |
| South Africans | 96.4 /100 | #79 | Exceptional 5.0% |
| Argentineans | 96.2 /100 | #80 | Exceptional 5.0% |
| French | 96.2 /100 | #81 | Exceptional 5.0% |
| Chileans | 96.2 /100 | #82 | Exceptional 5.0% |
| Immigrants | Eritrea | 96.0 /100 | #83 | Exceptional 5.0% |
| Serbians | 95.7 /100 | #84 | Exceptional 5.1% |