Kenyan vs Immigrants from Pakistan Unemployment Among Ages 35 to 44 years
COMPARE
Kenyan
Immigrants from Pakistan
Unemployment Among Ages 35 to 44 years
Unemployment Among Ages 35 to 44 years Comparison
Kenyans
Immigrants from Pakistan
4.4%
UNEMPLOYMENT AMONG AGES 35 TO 44 YEARS
95.7/ 100
METRIC RATING
80th/ 347
METRIC RANK
4.3%
UNEMPLOYMENT AMONG AGES 35 TO 44 YEARS
99.2/ 100
METRIC RATING
30th/ 347
METRIC RANK
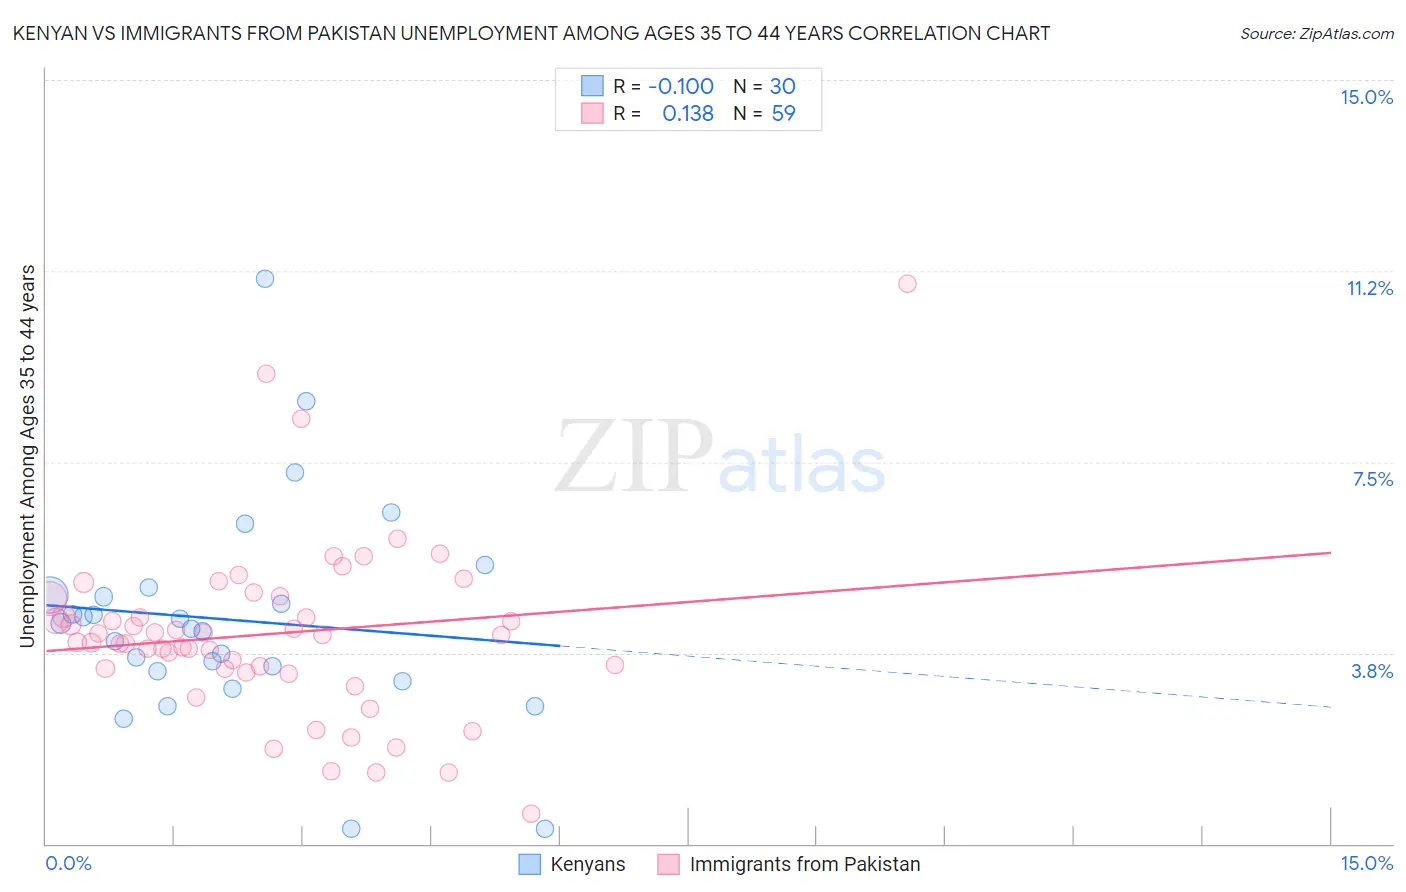
Kenyan vs Immigrants from Pakistan Unemployment Among Ages 35 to 44 years Correlation Chart
The statistical analysis conducted on geographies consisting of 167,131,025 people shows a slight negative correlation between the proportion of Kenyans and unemployment rate among population between the ages 35 and 44 in the United States with a correlation coefficient (R) of -0.100 and weighted average of 4.4%. Similarly, the statistical analysis conducted on geographies consisting of 280,835,646 people shows a poor positive correlation between the proportion of Immigrants from Pakistan and unemployment rate among population between the ages 35 and 44 in the United States with a correlation coefficient (R) of 0.138 and weighted average of 4.3%, a difference of 3.3%.
Unemployment Among Ages 35 to 44 years Correlation Summary
| Measurement | Kenyan | Immigrants from Pakistan |
| Minimum | 0.30% | 0.60% |
| Maximum | 11.1% | 11.0% |
| Range | 10.8% | 10.4% |
| Mean | 4.4% | 4.1% |
| Median | 4.3% | 4.1% |
| Interquartile 25% (IQ1) | 3.4% | 3.4% |
| Interquartile 75% (IQ3) | 4.9% | 4.8% |
| Interquartile Range (IQR) | 1.5% | 1.4% |
| Standard Deviation (Sample) | 2.1% | 1.7% |
| Standard Deviation (Population) | 2.1% | 1.7% |
Similar Demographics by Unemployment Among Ages 35 to 44 years
Demographics Similar to Kenyans by Unemployment Among Ages 35 to 44 years
In terms of unemployment among ages 35 to 44 years, the demographic groups most similar to Kenyans are Immigrants from Scotland (4.4%, a difference of 0.050%), Immigrants from Asia (4.4%, a difference of 0.050%), Immigrants from Sweden (4.4%, a difference of 0.070%), Indian (Asian) (4.4%, a difference of 0.12%), and Dutch (4.4%, a difference of 0.18%).
| Demographics | Rating | Rank | Unemployment Among Ages 35 to 44 years |
| Lithuanians | 96.5 /100 | #73 | Exceptional 4.4% |
| Poles | 96.4 /100 | #74 | Exceptional 4.4% |
| Immigrants | Romania | 96.3 /100 | #75 | Exceptional 4.4% |
| Immigrants | Jordan | 96.3 /100 | #76 | Exceptional 4.4% |
| Dutch | 96.1 /100 | #77 | Exceptional 4.4% |
| Indians (Asian) | 96.0 /100 | #78 | Exceptional 4.4% |
| Immigrants | Sweden | 95.9 /100 | #79 | Exceptional 4.4% |
| Kenyans | 95.7 /100 | #80 | Exceptional 4.4% |
| Immigrants | Scotland | 95.6 /100 | #81 | Exceptional 4.4% |
| Immigrants | Asia | 95.6 /100 | #82 | Exceptional 4.4% |
| Immigrants | Australia | 95.3 /100 | #83 | Exceptional 4.4% |
| Immigrants | Chile | 95.2 /100 | #84 | Exceptional 4.4% |
| Immigrants | Kenya | 95.0 /100 | #85 | Exceptional 4.4% |
| Serbians | 94.9 /100 | #86 | Exceptional 4.4% |
| Immigrants | Bosnia and Herzegovina | 94.8 /100 | #87 | Exceptional 4.4% |
Demographics Similar to Immigrants from Pakistan by Unemployment Among Ages 35 to 44 years
In terms of unemployment among ages 35 to 44 years, the demographic groups most similar to Immigrants from Pakistan are Carpatho Rusyn (4.3%, a difference of 0.040%), European (4.3%, a difference of 0.070%), Chinese (4.3%, a difference of 0.14%), Immigrants from Sri Lanka (4.3%, a difference of 0.24%), and Immigrants from Japan (4.3%, a difference of 0.26%).
| Demographics | Rating | Rank | Unemployment Among Ages 35 to 44 years |
| Immigrants | Kuwait | 99.5 /100 | #23 | Exceptional 4.3% |
| Tlingit-Haida | 99.5 /100 | #24 | Exceptional 4.3% |
| Bulgarians | 99.3 /100 | #25 | Exceptional 4.3% |
| Turks | 99.3 /100 | #26 | Exceptional 4.3% |
| Assyrians/Chaldeans/Syriacs | 99.3 /100 | #27 | Exceptional 4.3% |
| Immigrants | Japan | 99.3 /100 | #28 | Exceptional 4.3% |
| Europeans | 99.2 /100 | #29 | Exceptional 4.3% |
| Immigrants | Pakistan | 99.2 /100 | #30 | Exceptional 4.3% |
| Carpatho Rusyns | 99.2 /100 | #31 | Exceptional 4.3% |
| Chinese | 99.1 /100 | #32 | Exceptional 4.3% |
| Immigrants | Sri Lanka | 99.1 /100 | #33 | Exceptional 4.3% |
| Jordanians | 99.0 /100 | #34 | Exceptional 4.3% |
| Luxembourgers | 99.0 /100 | #35 | Exceptional 4.3% |
| Mongolians | 98.9 /100 | #36 | Exceptional 4.3% |
| Immigrants | Zimbabwe | 98.9 /100 | #37 | Exceptional 4.3% |