Jamaican vs Immigrants from Japan Unemployment Among Ages 16 to 19 years
COMPARE
Jamaican
Immigrants from Japan
Unemployment Among Ages 16 to 19 years
Unemployment Among Ages 16 to 19 years Comparison
Jamaicans
Immigrants from Japan
21.7%
UNEMPLOYMENT AMONG AGES 16 TO 19 YEARS
0.0/ 100
METRIC RATING
313th/ 347
METRIC RANK
16.6%
UNEMPLOYMENT AMONG AGES 16 TO 19 YEARS
98.9/ 100
METRIC RATING
65th/ 347
METRIC RANK
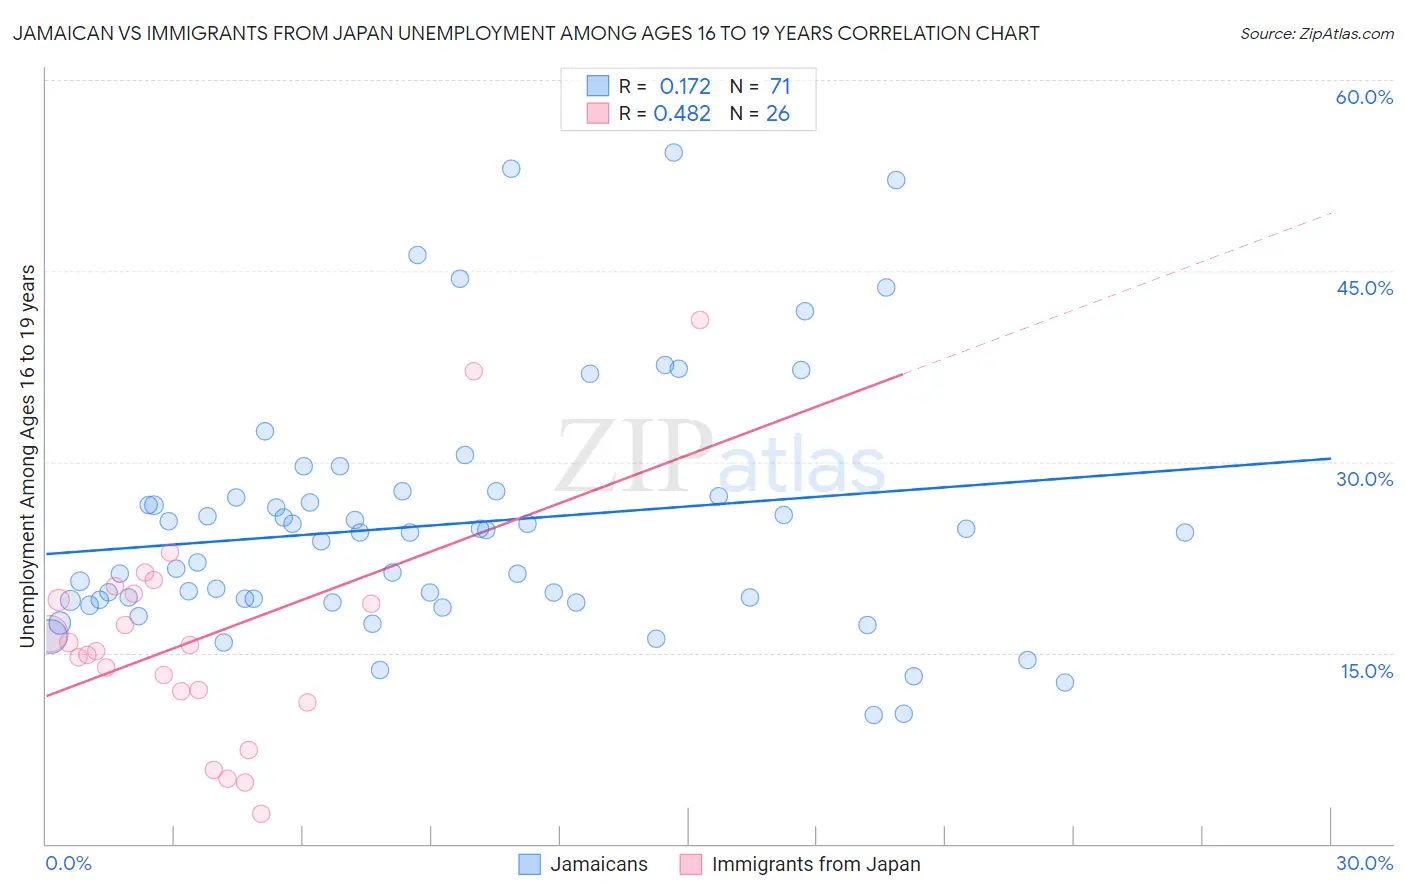
Jamaican vs Immigrants from Japan Unemployment Among Ages 16 to 19 years Correlation Chart
The statistical analysis conducted on geographies consisting of 350,975,671 people shows a poor positive correlation between the proportion of Jamaicans and unemployment rate among population between the ages 16 and 19 in the United States with a correlation coefficient (R) of 0.172 and weighted average of 21.7%. Similarly, the statistical analysis conducted on geographies consisting of 326,097,714 people shows a moderate positive correlation between the proportion of Immigrants from Japan and unemployment rate among population between the ages 16 and 19 in the United States with a correlation coefficient (R) of 0.482 and weighted average of 16.6%, a difference of 30.5%.
Unemployment Among Ages 16 to 19 years Correlation Summary
| Measurement | Jamaican | Immigrants from Japan |
| Minimum | 10.1% | 2.4% |
| Maximum | 54.3% | 41.1% |
| Range | 44.2% | 38.7% |
| Mean | 25.1% | 16.1% |
| Median | 24.4% | 15.4% |
| Interquartile 25% (IQ1) | 19.1% | 12.0% |
| Interquartile 75% (IQ3) | 27.3% | 19.6% |
| Interquartile Range (IQR) | 8.2% | 7.6% |
| Standard Deviation (Sample) | 9.7% | 8.7% |
| Standard Deviation (Population) | 9.7% | 8.6% |
Similar Demographics by Unemployment Among Ages 16 to 19 years
Demographics Similar to Jamaicans by Unemployment Among Ages 16 to 19 years
In terms of unemployment among ages 16 to 19 years, the demographic groups most similar to Jamaicans are Alaska Native (21.8%, a difference of 0.16%), Houma (21.6%, a difference of 0.41%), Belizean (21.6%, a difference of 0.67%), Vietnamese (21.5%, a difference of 0.89%), and Native/Alaskan (21.5%, a difference of 0.95%).
| Demographics | Rating | Rank | Unemployment Among Ages 16 to 19 years |
| U.S. Virgin Islanders | 0.0 /100 | #306 | Tragic 21.3% |
| Blacks/African Americans | 0.0 /100 | #307 | Tragic 21.4% |
| Immigrants | Bangladesh | 0.0 /100 | #308 | Tragic 21.5% |
| Natives/Alaskans | 0.0 /100 | #309 | Tragic 21.5% |
| Vietnamese | 0.0 /100 | #310 | Tragic 21.5% |
| Belizeans | 0.0 /100 | #311 | Tragic 21.6% |
| Houma | 0.0 /100 | #312 | Tragic 21.6% |
| Jamaicans | 0.0 /100 | #313 | Tragic 21.7% |
| Alaska Natives | 0.0 /100 | #314 | Tragic 21.8% |
| Immigrants | Dominica | 0.0 /100 | #315 | Tragic 21.9% |
| Tohono O'odham | 0.0 /100 | #316 | Tragic 22.1% |
| Immigrants | Belize | 0.0 /100 | #317 | Tragic 22.2% |
| Immigrants | Jamaica | 0.0 /100 | #318 | Tragic 22.2% |
| Immigrants | West Indies | 0.0 /100 | #319 | Tragic 22.2% |
| Cheyenne | 0.0 /100 | #320 | Tragic 22.3% |
Demographics Similar to Immigrants from Japan by Unemployment Among Ages 16 to 19 years
In terms of unemployment among ages 16 to 19 years, the demographic groups most similar to Immigrants from Japan are Okinawan (16.6%, a difference of 0.030%), Northern European (16.6%, a difference of 0.10%), Scotch-Irish (16.6%, a difference of 0.16%), Slavic (16.7%, a difference of 0.20%), and Chickasaw (16.7%, a difference of 0.20%).
| Demographics | Rating | Rank | Unemployment Among Ages 16 to 19 years |
| Immigrants | Uganda | 99.4 /100 | #58 | Exceptional 16.5% |
| Irish | 99.4 /100 | #59 | Exceptional 16.5% |
| Menominee | 99.3 /100 | #60 | Exceptional 16.6% |
| Immigrants | Cuba | 99.2 /100 | #61 | Exceptional 16.6% |
| Macedonians | 99.2 /100 | #62 | Exceptional 16.6% |
| Scotch-Irish | 99.1 /100 | #63 | Exceptional 16.6% |
| Northern Europeans | 99.0 /100 | #64 | Exceptional 16.6% |
| Immigrants | Japan | 98.9 /100 | #65 | Exceptional 16.6% |
| Okinawans | 98.9 /100 | #66 | Exceptional 16.6% |
| Slavs | 98.7 /100 | #67 | Exceptional 16.7% |
| Chickasaw | 98.7 /100 | #68 | Exceptional 16.7% |
| Serbians | 98.7 /100 | #69 | Exceptional 16.7% |
| Austrians | 98.6 /100 | #70 | Exceptional 16.7% |
| Latvians | 98.5 /100 | #71 | Exceptional 16.7% |
| Immigrants | Canada | 98.5 /100 | #72 | Exceptional 16.7% |