Jamaican vs Tlingit-Haida Unemployment Among Ages 16 to 19 years
COMPARE
Jamaican
Tlingit-Haida
Unemployment Among Ages 16 to 19 years
Unemployment Among Ages 16 to 19 years Comparison
Jamaicans
Tlingit-Haida
21.7%
UNEMPLOYMENT AMONG AGES 16 TO 19 YEARS
0.0/ 100
METRIC RATING
313th/ 347
METRIC RANK
23.5%
UNEMPLOYMENT AMONG AGES 16 TO 19 YEARS
0.0/ 100
METRIC RATING
329th/ 347
METRIC RANK
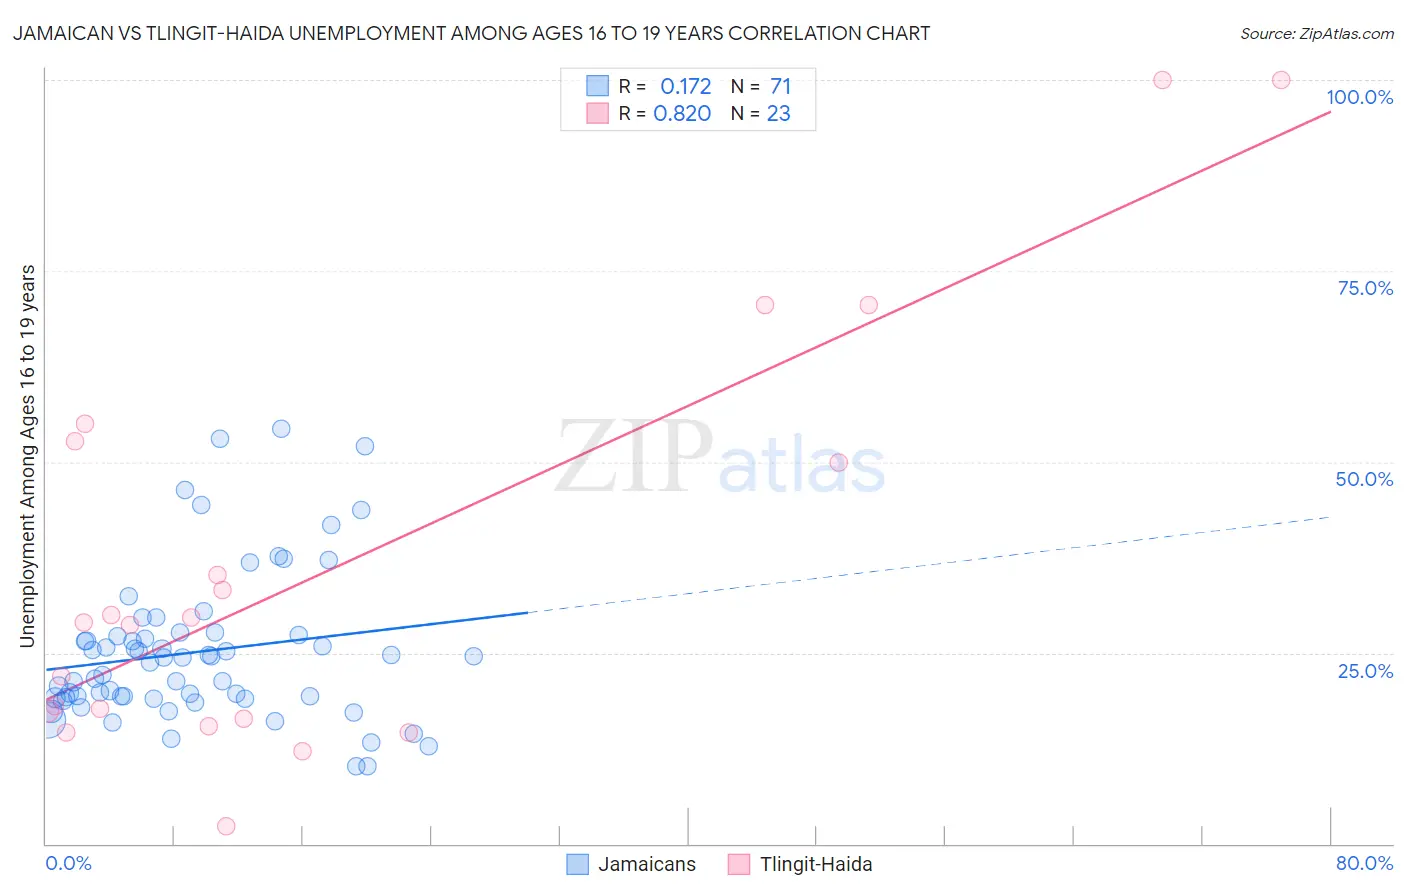
Jamaican vs Tlingit-Haida Unemployment Among Ages 16 to 19 years Correlation Chart
The statistical analysis conducted on geographies consisting of 350,975,671 people shows a poor positive correlation between the proportion of Jamaicans and unemployment rate among population between the ages 16 and 19 in the United States with a correlation coefficient (R) of 0.172 and weighted average of 21.7%. Similarly, the statistical analysis conducted on geographies consisting of 59,818,277 people shows a very strong positive correlation between the proportion of Tlingit-Haida and unemployment rate among population between the ages 16 and 19 in the United States with a correlation coefficient (R) of 0.820 and weighted average of 23.5%, a difference of 8.4%.
Unemployment Among Ages 16 to 19 years Correlation Summary
| Measurement | Jamaican | Tlingit-Haida |
| Minimum | 10.1% | 2.3% |
| Maximum | 54.3% | 100.0% |
| Range | 44.2% | 97.7% |
| Mean | 25.1% | 36.3% |
| Median | 24.4% | 28.9% |
| Interquartile 25% (IQ1) | 19.1% | 16.4% |
| Interquartile 75% (IQ3) | 27.3% | 52.6% |
| Interquartile Range (IQR) | 8.2% | 36.2% |
| Standard Deviation (Sample) | 9.7% | 27.2% |
| Standard Deviation (Population) | 9.7% | 26.6% |
Demographics Similar to Jamaicans and Tlingit-Haida by Unemployment Among Ages 16 to 19 years
In terms of unemployment among ages 16 to 19 years, the demographic groups most similar to Jamaicans are Alaska Native (21.8%, a difference of 0.16%), Houma (21.6%, a difference of 0.41%), Belizean (21.6%, a difference of 0.67%), Immigrants from Dominica (21.9%, a difference of 1.0%), and Tohono O'odham (22.1%, a difference of 1.6%). Similarly, the demographic groups most similar to Tlingit-Haida are Dominican (23.6%, a difference of 0.44%), Immigrants from Dominican Republic (23.3%, a difference of 1.1%), Pima (23.1%, a difference of 1.7%), British West Indian (24.0%, a difference of 1.8%), and Immigrants from Trinidad and Tobago (23.1%, a difference of 2.0%).
| Demographics | Rating | Rank | Unemployment Among Ages 16 to 19 years |
| Belizeans | 0.0 /100 | #311 | Tragic 21.6% |
| Houma | 0.0 /100 | #312 | Tragic 21.6% |
| Jamaicans | 0.0 /100 | #313 | Tragic 21.7% |
| Alaska Natives | 0.0 /100 | #314 | Tragic 21.8% |
| Immigrants | Dominica | 0.0 /100 | #315 | Tragic 21.9% |
| Tohono O'odham | 0.0 /100 | #316 | Tragic 22.1% |
| Immigrants | Belize | 0.0 /100 | #317 | Tragic 22.2% |
| Immigrants | Jamaica | 0.0 /100 | #318 | Tragic 22.2% |
| Immigrants | West Indies | 0.0 /100 | #319 | Tragic 22.2% |
| Cheyenne | 0.0 /100 | #320 | Tragic 22.3% |
| West Indians | 0.0 /100 | #321 | Tragic 22.4% |
| Barbadians | 0.0 /100 | #322 | Tragic 22.5% |
| Yakama | 0.0 /100 | #323 | Tragic 22.5% |
| Immigrants | Armenia | 0.0 /100 | #324 | Tragic 22.6% |
| Trinidadians and Tobagonians | 0.0 /100 | #325 | Tragic 22.6% |
| Immigrants | Trinidad and Tobago | 0.0 /100 | #326 | Tragic 23.1% |
| Pima | 0.0 /100 | #327 | Tragic 23.1% |
| Immigrants | Dominican Republic | 0.0 /100 | #328 | Tragic 23.3% |
| Tlingit-Haida | 0.0 /100 | #329 | Tragic 23.5% |
| Dominicans | 0.0 /100 | #330 | Tragic 23.6% |
| British West Indians | 0.0 /100 | #331 | Tragic 24.0% |